
-XX:MaxRAMPercentage is not what I wished for
This entry has been marinating for most of the year 2020. I should have published this opinion way earlier maybe end of 2019, but it took me time to realise I should split a bigger piece in smaller articles that hopefully made sense on their own.
The silly mistake
Like many I was happy to see the JDK landed support for containers in Java 9,
and that it was backported to Java 8 as well. Now the JDK 11 enables this
support by default. This change made the JVM able to read information from the
cgroup, and the -XX:*RAMPercentage flag family tells the JVM which proportion
of the available memory for this cgroup can be used.
In 2019, I had the chance the work on GKE (Google Kubernetes Engine) and putting Java applications in docker containers. Then bad production experiences arose that led me to think this flag may not be the right answer when applications are run in containers. This opinion could be biased toward the application mileage and in the context they were run.
This flag did not work as I expected it to be, and I’m a bit the culprit on this one
as I failed to properly research.
I didn’t refresh this knowledge either at that time.
When this flag appeared –- as a fraction based flags first (*RAMFraction) — mostly blogs
explored the new options (like this one),
many thanks to authors of these blogs who did the research.
However, these blogs silently passed over the fact that *RamPercentage is
about the Java heap (the same way MaxRAM is about Java heap), I simply
overlooked that too. In retrospect, even without research I should
have noticed this, as I wasn’t ignorant of Java native memory.
If I turned on blogs first it’s because the official documentation doesn’t even mention
any *RAMPercentage flags:
I should have turned right away to this awesome contribution from Chris Newland, he wrote a tool that indexes flag’s documentations, defaults and other metadata in various OpenJDK codebase.
| Name | Since | Deprecated | Type | OS | CPU | Component | Default | Availability | Description | Defined in |
|---|---|---|---|---|---|---|---|---|---|---|
MaxRAMPercentage |
JDK10 |
double |
gc |
25.0 range(0.0, 100.0) |
product |
Maximum percentage of real memory used for maximum heap size |
|
I knew this tool beforehand, yet I didn’t use Chris’s website first, I should have, and you should too.
Naming things is hard and I think this flag family should have been called something
like *HeapPercentageOfRAM to prevent stupid errors.
|
How the issue happened
This should have led enough free space but instead the application eventually hit the memory limit. Naturally the application got killed by the OS. More dramatically all replicas eventually got quickly oomkilled after some time, which led Kubernetes to always deploy new pods.
This application worked very well on a different datacenter handling all the traffic with
a heap of 2 GiB. The instances in Kubernetes could handle half of the traffic well but
not the entire traffic.
In short when the traffic on kubernetes instances got increased to 100% the pods started to get oom-killed.
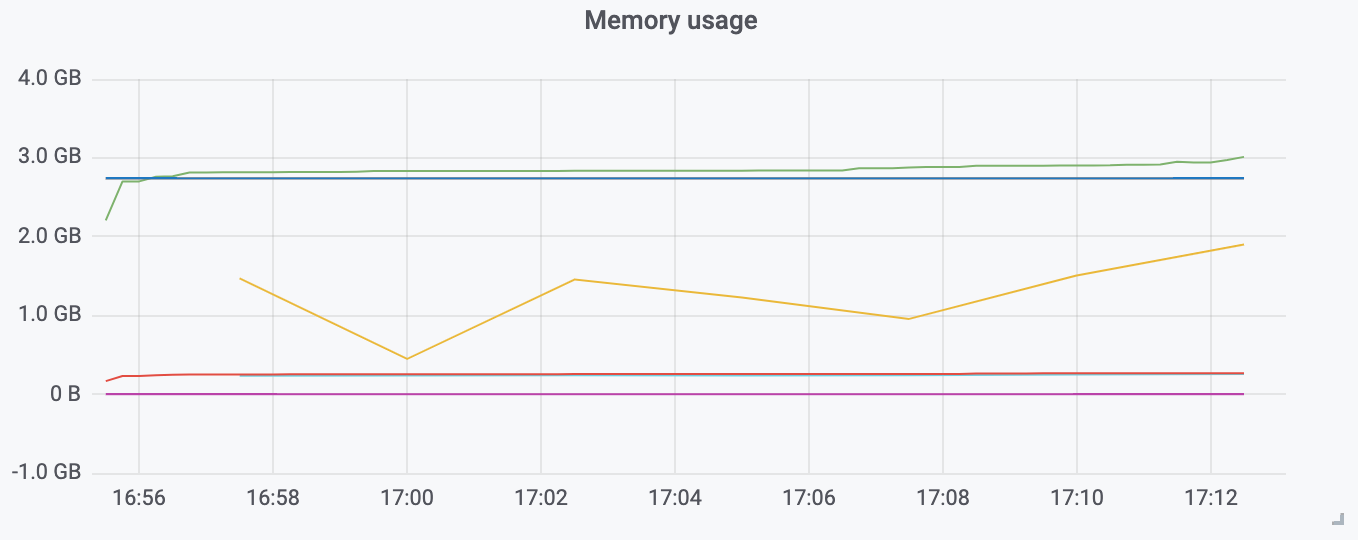
Caution, this graph has a slight issue as it displays data in metric bytes while in reality this should be IEC bytes.
Above we can see the trend of the Resident Set Size in green,
the Java heap limit (85% of 3 GiB), and in yellow the current heap usage.
|
Most of the time, figures will use the IEC binary notation ( Some charts may however use the SI metric notation ( Actually, 227,893 KB is only 222 MB. For ease of discussion, I’ll truncate the KBs part by 1,000 in this chapter; pretend I’m a disk manufacturer.
— Java Performance: The Definitive Guide
Getting the Most Out of Your Code (1st Edition) Thanks to this tweet. |
With *RAMPercentage should I just raise available memory ?
This application don’t have memory leaks. So we have two parameters on why it’s possible to adjust memory :
-
The cgroup available memory (set via Kubernetes deployment object key
.resources.limits.memory). -
The Java Heap parameters.
Yet the premise is to use MaxRAMPercentage which defines a percentage of
the former option (cgroup’s available memory), that would suggests that we only have
to raise the available memory.
apiVersion: extensions/v1beta1
kind: Deployment
metadata:
  name: "java-app"
spec:
  template:
    spec:
      containers:
      - name: "java-app"
        resources:
          limits:
            cpu: "8"
            memory: "5Gi" (1)
          requests:
            cpu: "3"
memory: "3Gi"| 1 | Increasing the working memory limit. |
|
The resources tree is equivalent to this docker params
The memory request is only used for scheduling the pod on a node. |
That would be really convenient!
In practice, I found this approach lacking, and inefficient for various reasons :
-
It’s just easy to raise the memory limit, but this may have a hidden cost, as this percentage is not adjusted. If the deployment requires a limit of 6 GiB, to work while the application is only using 3 GiB (if the application don’t need OS cache), then it has two consequences
-
larger application will impact negatively Kubernetes scheduling (which selects where to run the container), either on this very application or on sibling containers.
-
this cluster cost more than what is consume.
-
-
This immediately leads to this point: the percentage used in
MaxRAMPercentagecan’t stay a fixed value, it needs adjustment like we used to forXmxstyle flags, and for the same reasons:-
the traffic load may change
-
the number of instances or replicas may change
-
application code may change the mileage
-
-
Adjusting the memory of either the Java Heap or the limit of the container is annoying because
MaxRAMPercentagerequires to perform a rule of three. This may seem petty but it’s just easier to work with actual values, here percentage have no real benefits. -
GC parameters also use percentages, which forces sometime to calculate percentage of percentage.
-
Using percentage for Java heap makes us dismiss an entire facet of the memory, native memory. This memory in particular does grow too, but with in the same way than heap.
-
Moreover there’s other considerations to account for when measuring the RSS of the container (cgroup) which more or less includes the RSS of the process tree and the size of the tmpfs. The oomkiller takes all these to make sure the cgroup respects the defined memory limit.
Final words
Concretely I find no compelling argument in favor of *RAMPercentage flags,
I don’t know if I’m old school, or mathematics-averse but I find Xms / Xmx
easier to work with even in the context of containers.
Using memory settings with a unit encourage one to understand how an application is working, what constitutes the RSS for a Java process (which I’ll explore in an article maturing a bit longer).
Finally I’m not sure about what MaxRAMPercentage tried to solve, but today I won’t expect to use it soon. Maybe the soft max heap that is currently getting worked on will be more useful.