
Handling native memory fragmentation of glibc
-
pmap inspector
-
glibc arenas (// cpu limit ?)
-
glibc thread cache introduced in 2.26 (ptmalloc2) (In glibc-2.26, TCache (per-thread cache), a new feature, was introduced in malloc.) ?
-
TCMalloc
-
Jemalloc
Back in July 2020, I had a pretty good picture of what was the memory usage, or more precisely the memory demands of the JVM workloads I had running in production. This resulted in the following article I published last year JVM’s off-heap memory.
I enumerates many sources of memory consumption, however it lacks there is another inconspicuous source of memory consumption that I wasn’t aware until out workload started to ran in memory constrained containers : native memory fragmentation.
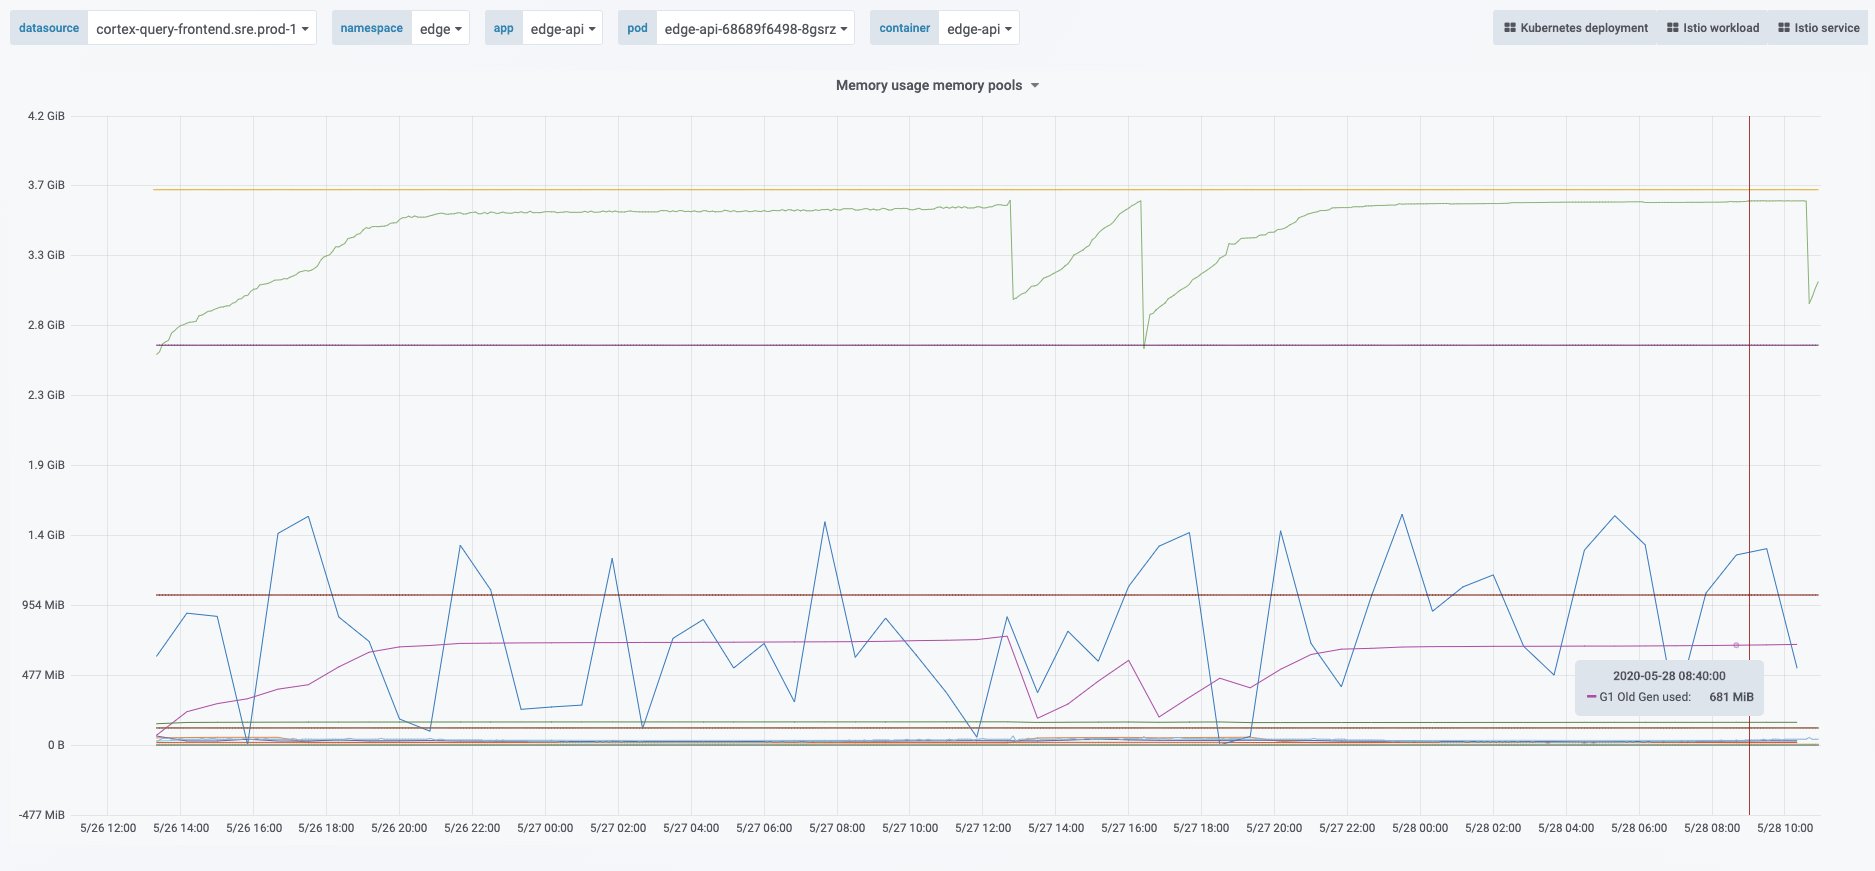
Different memory analysis didn’t add up
I spent time to identify where the memory was consumed for some
workload I tried to match the memory accounted by the Native Memory
Tracking report by the one reported via pmap : the sum
of the memory mapping sizes were always significantly higher. More importantly
the RSS of the workloads kept growing, while NMT didn’t report significant
increase.
DirectByteBuffers weren’t responsible either, their
number was relatively small and relatively stable, and there’s almost a handful
of very small memory mapped files (a few kilobytes at most) and their number
was stable too.
Then I focused my attention on native memory. I wasn’t sure were to start. My favorite search engine brought me a few results about glibc like this Q/A on stackoverflow, some mentioned a bug in glibc >= 2.10, 2.10 is pretty old, our production system use 2.28.0.
$ ldd --version
ldd (Debian GLIBC 2.28-10) 2.28
Copyright (C) 2018 Free Software Foundation, Inc.
This is free software; see the source for copying conditions.  There is NO
warranty; not even for MERCHANTABILITY or FITNESS FOR A PARTICULAR PURPOSE.
Written by Roland McGrath and Ulrich Drepper.
The comment on stackoverflow left open several questions:
-
Is it the same issue ?
-
Does this bug even apply ?
-
Maybe it’s fixed ?
-
Is it even a bug ?
Rather than answering these, this put me on the path of how glibc’s malloc
is handling native memory allocation.
As I’m quite cold on any native code I began to look at the malloc man page,
nothing picked up my interest until the very end in the note section:
To avoid corruption in multithreaded applications, mutexes are used internally to protect the memory-management data structures employed by these functions. In a multithreaded application in which threads simultaneously allocate and free memory, there could be contention for these mutexes. To scalably handle memory allocation in multithreaded applications, glibc creates additional memory allocation arenas if mutex contention is detected. Each arena is a large region of memory that is internally allocated by the system (using brk(2) or mmap(2)), and managed with its own mutexes.
This caught my attention To scalably handle memory allocation in multithreaded applications, glibc creates additional memory allocation arenas if mutex contention is detected. as this is what the answer in SO talks about.
| The word arena refers to a technic to manage memory. |
What exactly are these arenas ? How do they work?
In order to answer these questions, this section will dive in the glibc native memory allocator.
C programs can allocate memory in a heap. In order to allocate to the said
heap, native code calls malloc function. Which is in fact an interface, that
happens to be implemented in the standard glibc library that will in turn call
system functions like mmap and, brk/sbrk.

|
The source code of glibc is available there. The glibc hosts a variety of function, like The specific code we’re interested in is of course The header shows a few interesting information, it is based on
Doug Lea’s work and this
We can see this allocator claims to be memory-efficient, fast and stable for server applications.
This entry will show you there are better alternatives. |
On their wiki there is a
page presenting internals of
malloc, and there is in particular a very useful terminology:
Arena |
A structure that is shared among one or more threads which contains references to one or more heaps, as well as linked lists of chunks within those heaps which are "free". Threads assigned to each arena will allocate memory from that arena’s free lists. |
Heap |
A contiguous region of memory that is subdivided into chunks to be allocated. Each heap belongs to exactly one arena. |
Chunk |
A small range of memory that can be allocated (owned by the application), freed (owned by glibc), or combined with adjacent chunks into larger ranges. Note that a chunk is a wrapper around the block of memory that is given to the application. Each chunk exists in one heap and belongs to one arena. |
Memory |
A portion of the application’s address space which is typically backed by RAM or swap. |
Measuring the issue
I decided to analyse the memory mapping of the application, using the knowledge
gained by the use of pmap / procfs. However, to detect properly
the arena heaps, I will need several elements, the layout of the memory
mapping and its size.
Identifying arena characteristics
This section will mostly focus on glibc source code, and how I used it to have hard proof of what I am doing.
Arena size
Some people mentioned a 64 MiB mappings when talking about glibc, but without
proof or linking documentation. This number is interesting as it might ease
the ability to discover such segments.
So let’s first make sure this is indeed 64 MiB and always 64 MiB ; the
glibc source code is available there.
So let’s define what we might be interested in : In particular we are interested in the arena size, or the heap size.
Looking at the arena.c source file there’s some interesting definitions, in
particular it does define (MAX_HEAP_SIZE), it is the size of the biggest heap
in a single arena.
HEAP_MAX_SIZE in arena.c#define HEAP_MIN_SIZE (32 * 1024)
#ifndef HEAP_MAX_SIZE
# ifdef DEFAULT_MMAP_THRESHOLD_MAX (1)
# define HEAP_MAX_SIZE (2 * DEFAULT_MMAP_THRESHOLD_MAX) (2)
# else
# define HEAP_MAX_SIZE (1024 * 1024) /* must be a power of two */
# endif
#endif| 1 | DEFAULT_MMAP_THRESHOLD_MAX is always defined |
| 2 | The maximum heap size for an arena is \$(2 * "DEFAULT_MMAP_THRESHOLD_MAX")\$ |
Looking at the DEFAULT_MMAP_THRESHOLD_MAX definition, we learn that it depends
on the type of architecture. I’m inspecting a 64-bit system.
DEFAULT_MMAP_THRESHOLD_MAX in malloc.c#ifndef DEFAULT_MMAP_THRESHOLD_MAX
/* For 32-bit platforms we cannot increase the maximum mmap
threshold much because it is also the minimum value for the
maximum heap size and its alignment. Going above 512k (i.e., 1M
for new heaps) wastes too much address space. */
# if __WORDSIZE == 32
# define DEFAULT_MMAP_THRESHOLD_MAX (512 * 1024)
# else
# define DEFAULT_MMAP_THRESHOLD_MAX (4 * 1024 * 1024 * sizeof(long)) (1)
# endif
#endif| 1 | DEFAULT_MMAP_THRESHOLD_MAX is then \$(4 * 1024 * 1024 * sizeof(long)) "bits"\$ |
The size of the long is usually the most painful information to get, as in C
it depends on the architecture, the OS and mostly the compiler. The minimum
guaranteed size of a long is 4 bytes (32 bits) but it can be more.
In my containers, if look at getconf, a little POSIX utility, to see the size
of a long and use this value as hint for my calculus.
$ getconf LONG_BIT
64
So if I suppose that glibc has been compiled using this configuration, a 4 byte
long, then:
\$"HEAP_MAX_SIZE" = 67108864 "bit"\$
\$"HEAP_MAX_SIZE" = 65536 "KiB"\$
\$"HEAP_MAX_SIZE" = 64 "MiB"\$
-
This value concords with the number others people were reporting.
-
This is a compile-time constant, and it is not tunable.
Now, I’d like to understand how this space is mapped.
Arena memory mapping
Also in the arena.c file there is an interesting function : new_heap,
this code describe how a heap is created.
new_heap {
  handle alignment
  mmap (0, HEAP_MAX_SIZE, PROT_NONE, MAP_NORESERVE) (1)
  mprotect (p2, size, MTAG_MMAP_FLAGS | PROT_READ | PROT_WRITE) (2)
}
| 1 | Reserves the 65536 KiB space with no permissions. |
| 2 | Immediately changes the permission to read and write for the initial size of this heap. |
From that I gather from a pmap output, a glibc malloc arena would look
this :
00007fe164000000    2736    2736    2736 rw---   [ anon ] (1)
00007fe1642ac000 62800 0 0 ----- [ anon ] (2)| 1 | The segment on which the permissions have been changed, this segment will grow as the heap size grows. |
| 2 | The rest of the reserved heap segment, this segment will get smaller if the heap grows. |
Note how sum of the mappings is equal to 64 MiB : 2736 + 62800 = 65536 !
| It’s worth saying that the same layout pattern could be achieved by any other native code, but in my case there’s no other third party library that does anything like this, so I’ll proceed with this idea. Be sure your code base! |
In order to actually make sure of the actual mapping, one could invoke the
native method malloc_info.
|
Inspecting the output of pmap
Usually on a JVM the memory mapping can be quite large and intimidating, while it is certainly possible to identify memory mapping patterns with the eye, it’s a tedious task and it does not scale when you need to repeat the process.
So I wrote my own parse to inspect pmap output, I chose to use pmap output
because it’s easier to transport out of a pod I like the single line by mapping.
It is certainly possible to parse the /proc/{pid}/smaps pseudo-file, as it
contains the same data.
The code of the pmap inspector is very basic, it takes a file, that is the
output of the command pmap -X {pid} and process each line trying to identify
the mapping.
Again at this stage this code is simple, certainly incomplete, and
it assumes a few hypotheses : Java 11, thread stack size is 1 MiB, stack
guards, glibc malloc usage.
While it’s unlikely to be 100% exact or even bulletproof this script is useful
enough to identify probable memory zones and their memory consumption.
|
pmap inspector gist
The important bit is not quite to get the reserved mapping size but to measure how much dirty pages there in the native segments.
         JAVA_HEAP count=1     reserved=4194304    rss=2746068
       MAPPED_FILE count=49    reserved=194712     rss=53704
  MAIN_NATIVE_HEAP count=1     reserved=884        rss=720
           UNKNOWN count=63    reserved=668200     rss=464716
       JAVA_THREAD count=447   reserved=459516     rss=59240
   NON_JAVA_THREAD count=24    reserved=24768      rss=332
  UNKNOWN_SEGMENT1 count=27    reserved=83052      rss=58204
  UNKNOWN_SEGMENT2 count=31    reserved=63488      rss=63328
      MALLOC_ARENA count=257   reserved=16875656   rss=1242072 (1)
 MAIN_NATIVE_STACK count=1     reserved=136        rss=36
KERNEL_MAPPING count=3 reserved=24 rss=8| 1 | malloc arena’s heaps uses ~1.2 GiB (1 242 072 KiB) |
How to remediate the situation ?
Native libraries usually offer a way to tune some behavior via environment variables, glibc is no different and documents a list of tunable parameters.
In particular, we would be interested in MALLOC_ARENA_MAX, but it immediately
raises a few questions:
-
How to tune it ?
-
Or more specifically how does it affect the
malloc's behavior ? -
Is it really effective ?
-
What could be the negative effects of a bad settings, e.g. less arena heaps but more contention on these heaps ?
Fortunately I am not alone to look at malloc arenas :
It’s been a long time since I didn’t do C programming and reading the malloc source is more tedious than the one from the JVM.
The glibc malloc is coupled with threads and the number of available CPUs.
A better explanation is available
there.
Some people had to tune a lot more glibc parameters to avoid fragmentation, see comments in this blog post.
In order to understand better what was happening I enabled the
-XX:+AlwaysPreTouch to remove the "noise" of memory paging in the heap (when
untouched region are accessed for the first time hours after start).
Instead of tuning glibc, I preferred to use a different allocator, requiring
much less effort and maintenance.
There are several options :
-
jemalloc (long history, robust)
-
tcmalloc (long history, now maintained by google)
-
minimalloc (efficient
malloccontribution from microsoft)
I used TCMalloc as it’s very old and maintained by google, and can be installed with allocation profiling tool. Others are fine, especially jemalloc that can come with allocation profiler as well. The results are very good, RSS is stable and even decreasing on lower activity.
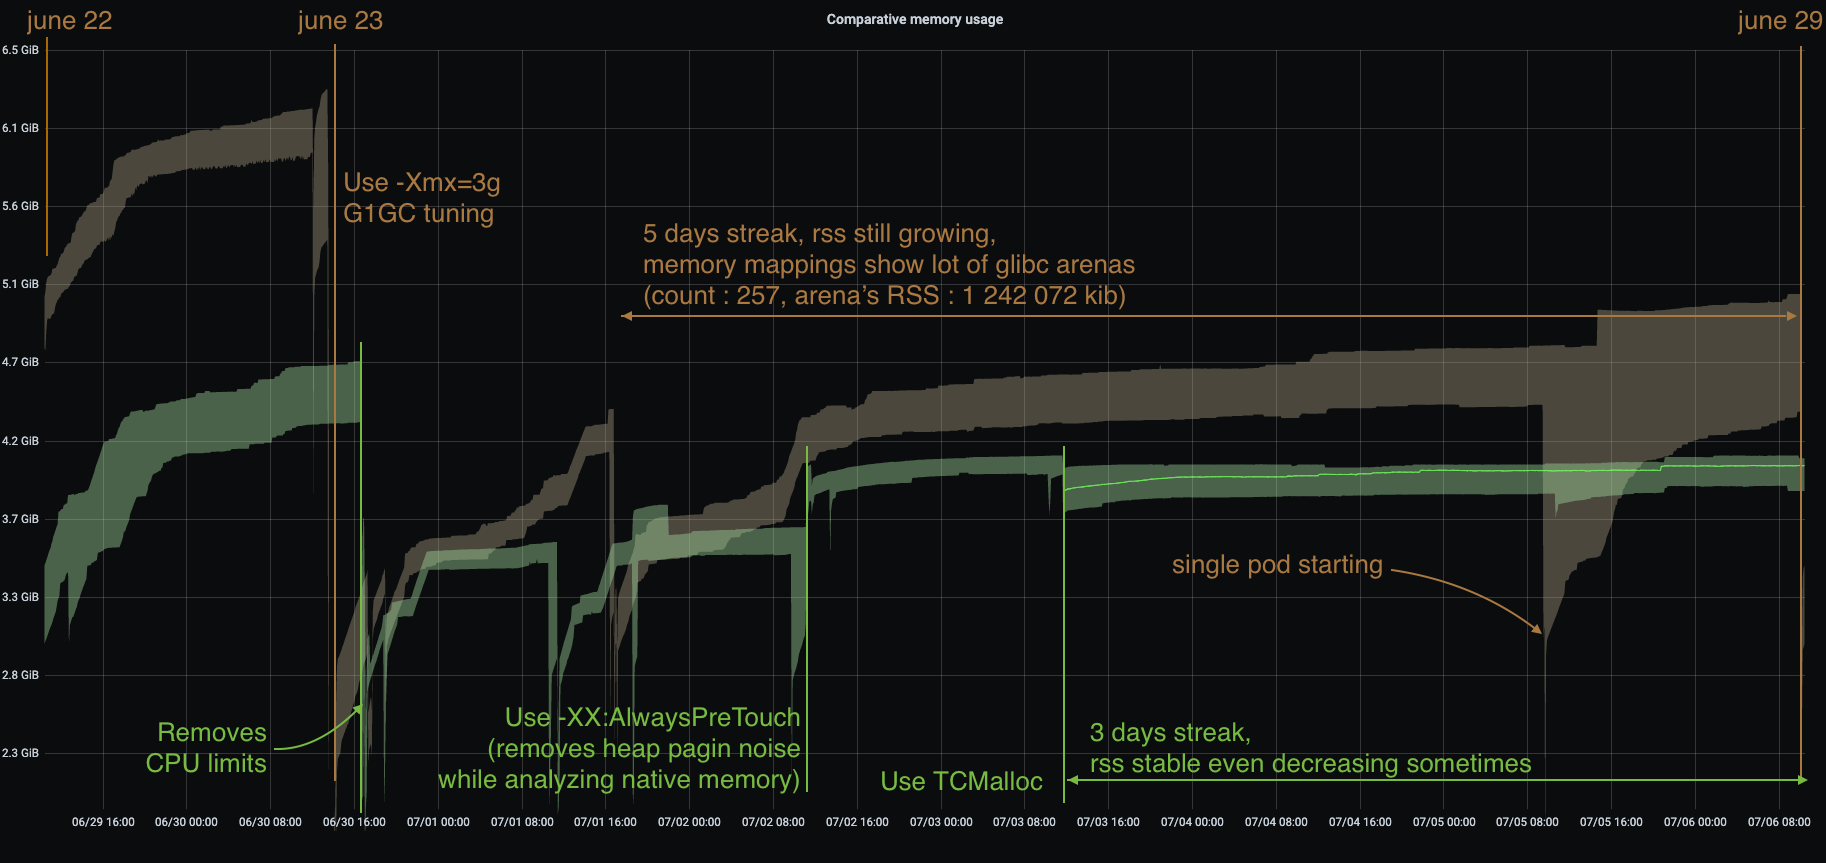
One thing to note: removing the CPU limits had a nice effect on glibc native memory usage, but I’m uncertain in the long run. I still need to understand that effect.
I ran tests using jemalloc. Immediately after deployment the jemalloc pods shows a higher memory usage in general that those running TCmalloc, in this test pods with the highest memory usage had over 400 MiB more. Also, the used memory is quite bumpy compared to TCMalloc, but jemalloc is able to give back memory to the OS.
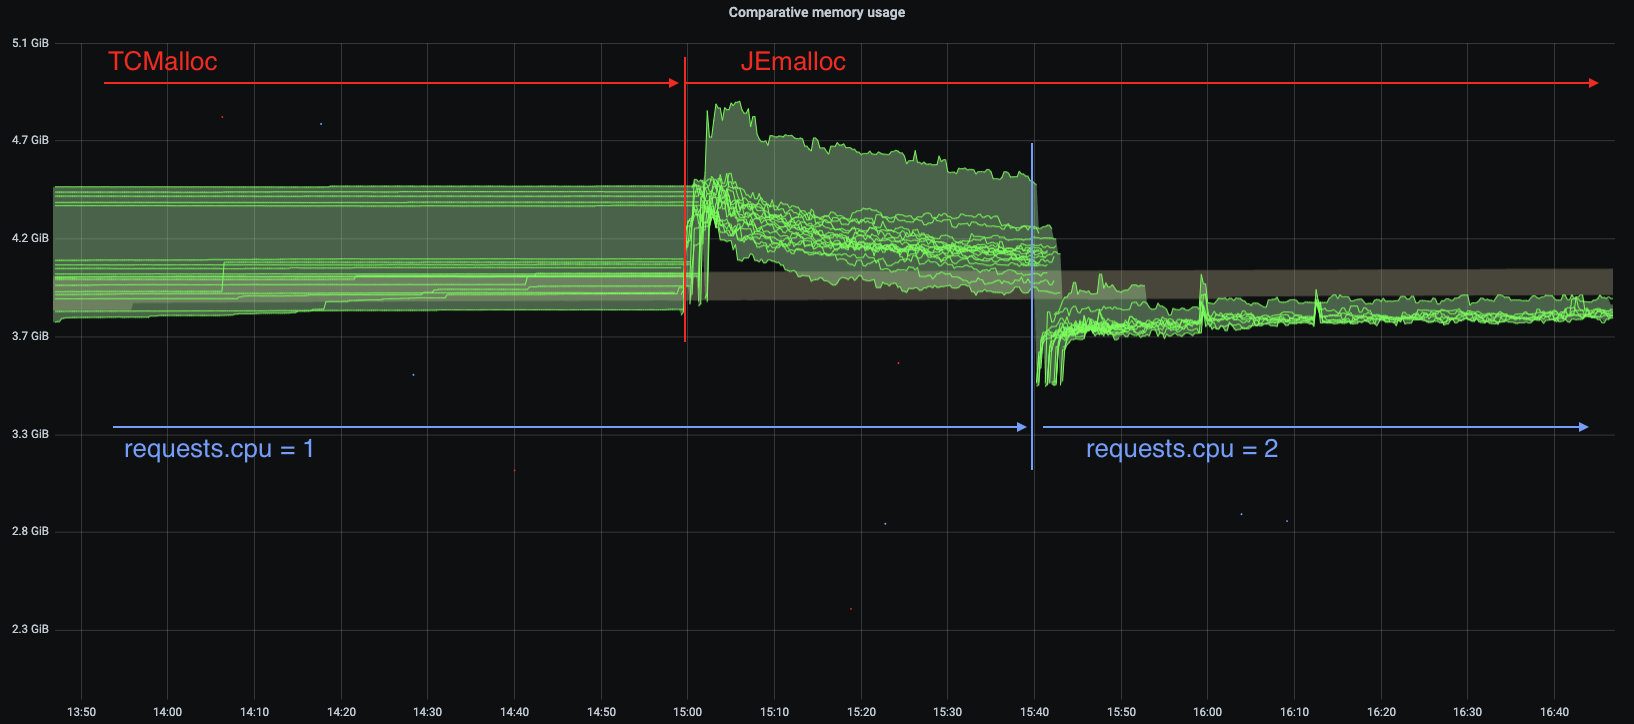
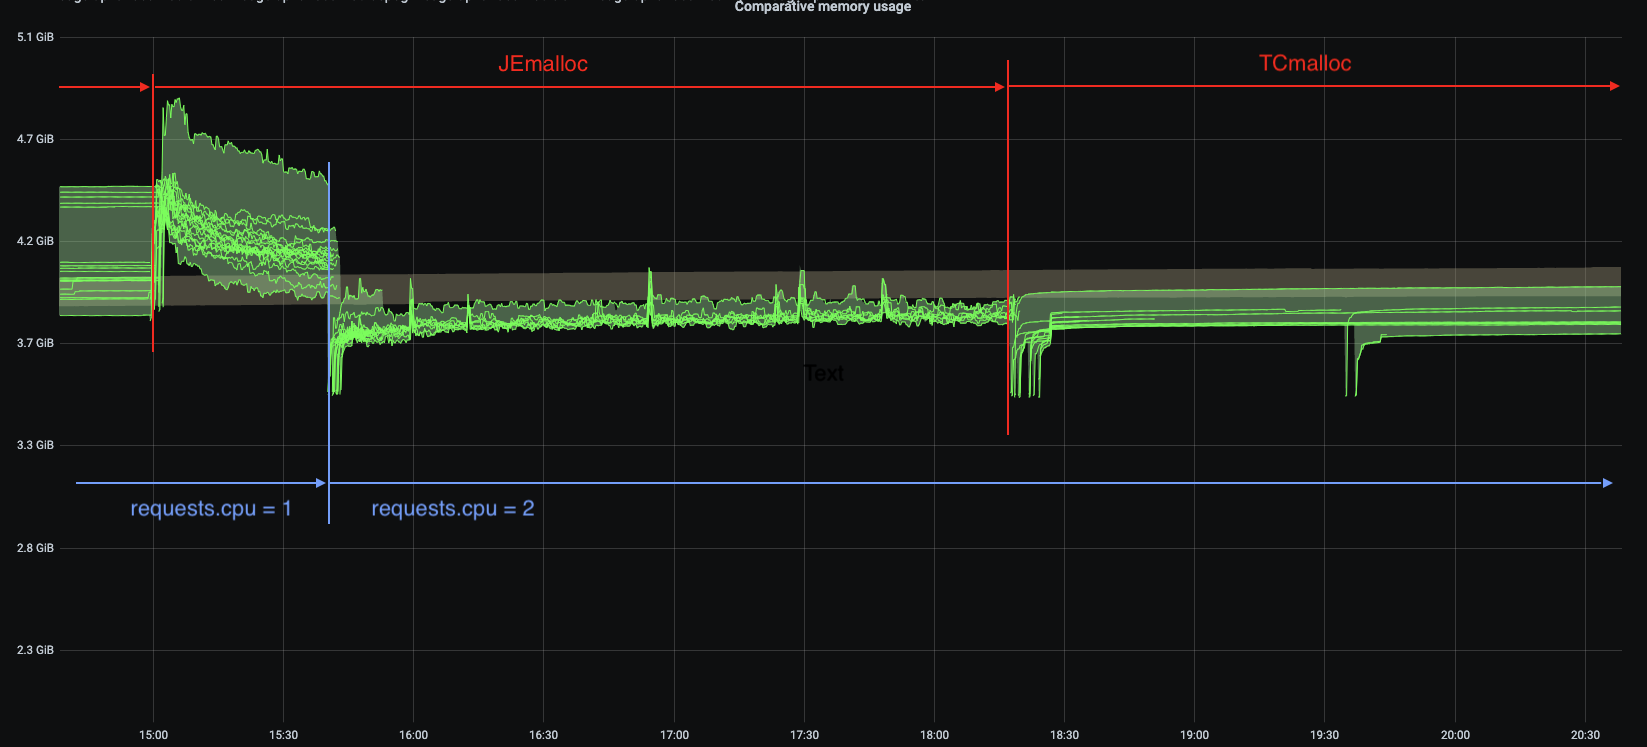
The other change in this graph is the number of CPU, this deployment was running
1 CPU. After bumping the requests.cpu to 2 the memory usage range is
smaller and memory usage is smaller in general.
tcmalloc vs jemalloc
Both libraries try to de-contention memory acquire by having threads pick the memory from different caches, but they have different strategies:
-
jemalloc(used by Facebook) maintains a cache per thread -
tcmalloc(from Google) maintains a pool of caches, and threads develop a “natural” affinity for a cache, but may change
This led, once again if I remember correctly, to an important difference in terms of thread management.
-
jemallocis faster if threads are static, for example using pools -
tcmallocis faster when threads are created/destructed
There is also the problem that since jemalloc spin new caches to accommodate new thread ids, having a sudden spike of threads will leave you with (mostly) empty caches in the subsequent calm phase.
As a result, I would recommend tcmalloc in the general case, and reserve
jemalloc for very specific usages (low variation on the number of threads
during the lifetime of the application).
Links
-
[Linux Process Memory Layout - int13](https://ewirch.github.io/2013/11/linux-process-memory-layout.html)
-
[Malloc Internals and You - Red Hat Developer](https://developers.redhat.com/blog/2017/03/02/malloc-internals-and-you/)
-
[An introduction to virtual memory - Internal Pointers](https://www.internalpointers.com/post/introduction-virtual-memory)
-
[Testing Memory Allocators: ptmalloc2 vs tcmalloc vs hoard vs jemalloc While Trying to Simulate Real-World Loads - IT Hare on Soft.ware](http://ithare.com/testing-memory-allocators-ptmalloc2-tcmalloc-hoard-jemalloc-while-trying-to-simulate-real-world-loads/)