
Using JDK FlightRecorder and JDK Mission Control
JDK Flight Recorder, the profiler you can use in production, continuously. Flight Recorder has been available before in the JDK, e.g. it shipped as part of the JDK 8, but to use it, it demanded a to set specific commercial VM flags to unlock FlightRecorder, this is not anymore necessary with Java 11.
This page assumes JDK 11, that means there is no need to set
-XX:+UnlockCommercialFeatures, -XX:+FlightRecorder flags. Or more particular to JFR
the use of -XX:+UnlockDiagnosticVMOptions and -XX:+DebugNonSafepoints
source
|
Brief introduction to JDK Flight Recorder
Flight Recorder is a feature backed in the JVM that traces what’s happening inside the JVM with events. FlightRecorder development started a long time ago in the early 2000, on a JVM named JRockit.
This JVM was first developed by a swedish company named Appeal, then Appeal got acquired by BEA. Oracle acquired BEA, then acquired Sun, and merged the source of JRockit to Hotspot.
At some point BEA/Appeal engineers needed insight in their JVM, in production, logging was not an option as it had too much overhead, so they designed an event based system to work reliably in production.
JDK Mission Control on the other end is a software that will analyze these events and build consolidated views for us to analyze.
JFR with JDK Mission Control together are similar to system architectured as Event Sourcing system.

I won’t dive in, but most profiler do have a bias when profiling and don’t report accurate results. The issue lies in how profiler handle JVM safepoints, most don’t account properly the time spent in safepoints. Some great profiler like the great async-profiler, are not subject to these biases, JFR is also not subject to it.
Here’s great material provided by Nitsan Wakart :
Using JFR
How to start a recording ?
One of the first interesting thing you can do is to start a recording at runtime ;
jcmd is the tool for this job, it’s the Swiss Army knife tool for to service your Java app.
If you don’t know it, use it, it’s really great !
Prior to Java 11 FlightRecorder had to be enabled before use. Now it’s not necessary anymore it’s possible to start a JFR session.
$ jcmd $(pgrep java) VM.flags -all | grep FlightRecorder
     bool FlightRecorder                           = true                                      {product} {management}
    ccstr FlightRecorderOptions                    =                                           {product} {default}
Just run JFR.start on the running java pid.
$ jcmd $(pidof java) JFR.start
6:
Started recording 2. No limit specified, using maxsize=250MB as default.

Use jcmd 6 JFR.dump name=2 filename=FILEPATH to copy recording data to file.
The output guides the user to the next useful commands, in particular JFR.dump.
Also, this commands tells you that a recording by default is limited to 250Mb.
jcmd provides the help command that describes document for each command options.
$ jcmd $(pgrep java) JFR.start \
  name=app-profile \
  duration=300s \
  filename=/tmp/app-profile-$(date +%FT%H-%M-%S).jfr \
  settings=profile
6:
Started recording 2. The result will be written to:

/tmp/app-profile-2020-03-26T16-41-48.jfr$ jcmd $(pgrep java) help JFR.start
6:
JFR.start
Starts a new JFR recording
Impact: Medium: Depending on the settings for a recording, the impact can range from low to high.
Permission: java.lang.management.ManagementPermission(monitor)
Syntax : JFR.start [options]
Options: (options must be specified using the <key> or <key>=<value> syntax)
name : [optional] Name that can be used to identify recording, e.g. \"My Recording\" (STRING, no default value)
settings : [optional] Settings file(s), e.g. profile or default. See JRE_HOME/lib/jfr (STRING SET, no default value)
delay : [optional] Delay recording start with (s)econds, (m)inutes), (h)ours), or (d)ays, e.g. 5h. (NANOTIME, 0)
duration : [optional] Duration of recording in (s)econds, (m)inutes, (h)ours, or (d)ays, e.g. 300s. (NANOTIME, 0)
disk : [optional] Recording should be persisted to disk (BOOLEAN, no default value)
filename : [optional] Resulting recording filename, e.g. \"/home/user/My Recording.jfr\" (STRING, no default value)
maxage : [optional] Maximum time to keep recorded data (on disk) in (s)econds, (m)inutes, (h)ours, or (d)ays, e.g. 60m, or 0 for no limit (NANOTIME, 0)
maxsize : [optional] Maximum amount of bytes to keep (on disk) in (k)B, (M)B or (G)B, e.g. 500M, or 0 for no limit (MEMORY SIZE, 0)
dumponexit : [optional] Dump running recording when JVM shuts down (BOOLEAN, no default value)
path-to-gc-roots : [optional] Collect path to GC roots (BOOLEAN, false)In production, you’ll be most likely using duration, maxsize, filename and settings options.
We’ll briefly look at other JFR commands after discussing the settings.
Later in this article we’ll see how to start recording from the command line
using -XX:StartFlightRecording.
|
Setting files
The settings option refers to a configuration of the FlightRecorder,
the JDK ships with two : default and profile. A configuration is an XML file, with
event elements that describe how JFR in the JVM will handle events, if they
are enabled, their threshold, if stacktraces are recorded, etc. And there is also a
control element that is used by JDK Mission Control.
Here’s the first few lines of the default settings. As its name impies, this is the configuration
that is used when the command is run without a settings option.
<?xml version="1.0" encoding="UTF-8"?>

<!--
     Recommended way to edit .jfc files is to use Java Mission Control,
     see Window -> Flight Recorder Template Manager.
-->

<configuration version="2.0"
               label="Continuous"
               description="Low overhead configuration safe for continuous use in production environments, typically less than 1 % overhead."
               provider="Oracle">

    <event name="jdk.ThreadAllocationStatistics">
      <setting name="enabled">true</setting>
      <setting name="period">everyChunk</setting>
    </event>

    <!-- a lot more events -->

    <!-- then the control element -->
</configuration>
In terms of file size magnitude on a pretty busy web application server using the default settings and for a
duration of 5 minutes, the resulting dumped file weighs 15 MiB. With this profile you’ll get more than
basic information, IO, GC events, locking behavior, thread events, method profiling, etc.
The announced overhead is maximum 1% !
<!--
     Recommended way to edit .jfc files is to use Java Mission Control,
     see Window -> Flight Recorder Template Manager.
-->

<configuration version="2.0"
               label="Profiling"
               description="Low overhead configuration for profiling, typically around 2 % overhead."
               provider="Oracle">

    <event name="jdk.ThreadAllocationStatistics">
      <setting name="enabled">true</setting>
      <setting name="period">everyChunk</setting>
    </event>

    <!-- a lot more event -->
</configuration>
With the profile settings, the dumped file takes around 35mb for a 5min duration. And it will
get access to additional events like the OldObjectSample stacktraces, or TLS events
like TLS handshakes, X509 validation, Classloading events, etc.
It actually has a tad more overhead, 2%. In most workload this should be ok.
To value of the settings option is file name of these files default or profile. In addition,
it’s also possible to pass an absolute file path, in other words it’s possible to use configuration
of our own stored elsewhere.
Dumping a recording
If it’s needed to acquire the recording, it’s possible to dump it at anytime.
$ jcmd $(pidof java) JFR.dump filename=/tmp/app-profile-$(date +%FT%H-%M-%S).jfr
6:
Dumped recording, 239.5 MB written to:

/tmp/app-profile-2020-06-26T15-16-57.jfr$ jcmd $(pgrep java) help JFR.dump
6:
JFR.dump
Copies contents of a JFR recording to file. Either the name or the recording id must be specified.
Impact: Low
Permission: java.lang.management.ManagementPermission(monitor)
Syntax : JFR.dump [options]
Options: (options must be specified using the <key> or <key>=<value> syntax)
name : [optional] Recording name, e.g. \"My Recording\" (STRING, no default value)
filename : [optional] Copy recording data to file, e.g. \"/home/user/My Recording.jfr\" (STRING, no default value)
maxage : [optional] Maximum duration to dump, in (s)econds, (m)inutes, (h)ours, or (d)ays, e.g. 60m, or 0 for no limit (NANOTIME, 0)
maxsize : [optional] Maximum amount of bytes to dump, in (M)B or (G)B, e.g. 500M, or 0 for no limit (MEMORY SIZE, 0)
begin : [optional] Point in time to dump data from, e.g. 09:00, 21:35:00, 2018-06-03T18:12:56.827Z, 2018-06-03T20:13:46.832, -10m, -3h, or -1d (STRING, no default value)
end : [optional] Point in time to dump data to, e.g. 09:00, 21:35:00, 2018-06-03T18:12:56.827Z, 2018-06-03T20:13:46.832, -10m, -3h, or -1d (STRING, no default value)
path-to-gc-roots : [optional] Collect path to GC roots (BOOLEAN, false)If there is a single recording at the time it’s possible to just use JFR.dump, but JFR is
powerful enough to support multiple concomitant recordings, in this case you need to specify
which recording to dump, obviously.
Some options override those defined in the start command like filename or maxage
for the current dump in particular. THe other options are certainly interesting but
I found them a bit less useful in practice.
Details of the active recording(s)
If they are multiple active recordings or if it’s necessary to check the event configuration
of the active recording jcmd comes with the JFR.check.
$ jcmd $(pgrep java) JFR.check
6:
Recording 2: name=2 maxsize=250.0MB (running)$ jcmd $(pgrep java) help JFR.check
6:
JFR.check
Checks running JFR recording(s)
Impact: Low
Permission: java.lang.management.ManagementPermission(monitor)
Syntax : JFR.check [options]
Options: (options must be specified using the <key> or <key>=<value> syntax)
name : [optional] Recording name, e.g. \"My Recording\" or omit to see all recordings (STRING, no default value)
verbose : [optional] Print event settings for the recording(s) (BOOLEAN, false)The verbose option allows examining which event are enabled for a recording.
Stopping a active recording
When the recording session is deemed over, then one can stop it providing a different file name than the one set in the start command.
$ jcmd $(pgrep java) JFR.stop \
  name=app-profile \
filename=/tmp/app-profile-$(date +%FT%H-%M-%S).jfr$ jcmd $(pgrep java) help JFR.stop
6:
JFR.stop
Stops a JFR recording
Impact: Low
Permission: java.lang.management.ManagementPermission(monitor)
Syntax : JFR.stop [options]
Options: (options must be specified using the <key> or <key>=<value> syntax)
name : Recording text,.e.g \"My Recording\" (STRING, no default value)
filename : [optional] Copy recording data to file, e.g. \"/home/user/My Recording.jfr\" (STRING, no default value)Global Flight Recorder configuration
What we saw before is how to start a recording and how to configure this specific recording. But there is another class of options that modifies aspects of the JFR internals. As a reminder those affects all recording in some way.
$ jcmd $(pidof java) JFR.configure \
  stackdepth=96 \
  repositorypath=/tmp/jfr-repo
6:
Repository path: /tmp/jfr-repo/2020_06_26_16_01_58_6

Dump path: /gclogs

Stack depth: 96

$ jcmd $(pidof java) JFR.configure
6:
Current configuration:

Repository path: /tmp/jfr-repo/2020_06_26_16_03_41_6

Stack depth: 96
Global buffer count: 20
Global buffer size: 512.0 kB
Thread buffer size: 8.0 kB
Memory size: 10.0 MB
Max chunk size: 12.0 MB
Sample threads: true$ jcmd $(pidof java) help JFR.configure
80657:
JFR.configure
Configure JFR
Impact: Low
Permission: java.lang.management.ManagementPermission(monitor)
Syntax : JFR.configure [options]
Options: (options must be specified using the <key> or <key>=<value> syntax)
repositorypath : [optional] Path to repository,.e.g \"My Repository\" (STRING, no default value)
dumppath : [optional] Path to dump,.e.g \"My Dump path\" (STRING, no default value)
stackdepth : [optional] Stack Depth (JULONG, 64)
globalbuffercount : [optional] Number of global buffers, (JULONG, 20)
globalbuffersize : [optional] Size of a global buffers, (MEMORY SIZE, 512k)
thread_buffer_size : [optional] Size of a thread buffer (MEMORY SIZE, 8k)
memorysize : [optional] Overall memory size, (MEMORY SIZE, 10m)
maxchunksize : [optional] Size of an individual disk chunk (MEMORY SIZE, 12m)
samplethreads : [optional] Activate Thread sampling (BOOLEAN, true)Here I’m increasing the stackdepth, this might be useful to generate more accurate flamegraphs,
or for some other analysis like with the OldObjectSample.
The repositorypath is where JFR dumps regularly slices or chunks of jfr events, they have
maximum size of maxchunksize. These files behave like a log rolling appender.
By default, these chunks are stored in the temporary directory and in a subfolder with a timestamp.
$ ls -lah /tmp/jfr-repo/2020_06_26_16_03_41_6/
total 71M
drwxr-xr-x 2 43514 root 4.0K Jun 26 16:21 .
drwxr-xr-x 3 43514 root 4.0K Jun 26 16:03 ..
-rw-r--r-- 1 43514 root 2.4M Jun 26 16:04 2020_06_26_16_04_02.jfr
-rw-r--r-- 1 43514 root 3.6M Jun 26 16:04 2020_06_26_16_04_12.jfr
-rw-r--r-- 1 43514 root  18M Jun 26 16:10 2020_06_26_16_04_47.jfr
-rw-r--r-- 1 43514 root 2.5M Jun 26 16:10 2020_06_26_16_10_18.jfr
-rw-r--r-- 1 43514 root  19M Jun 26 16:16 2020_06_26_16_10_26.jfr
-rw-r--r-- 1 43514 root  18M Jun 26 16:21 2020_06_26_16_16_16.jfr
-rw-r--r-- 1 43514 root    0 Jun 26 16:21 2020_06_26_16_21_50.jfr
-rw-r--r-- 1 43514 root 8.7M Jun 26 16:25 2020_06_26_16_21_50.part
I’m not sure why some chunks are over 12M (the default chunk size) at this time.
Careful however as some of these options are not well documented, and may not expose
what we’d expect, e.g. dumppath only affects dump created when the app crashes and only
if the dumponexit recording option is true.
These options are also available at startup via -XX:FlightRecorderOptions,
we’ll see later how to use this option.
|
JFR logs
Thanks to unified logging, it’s easy to open the hood on any JVM runtime feature. In order to follow JFR, it’s possible to JFR component, to understand how it works and how options affect recordings.
-Xlog:jfr[0.337s][info][jfr] Flight Recorder initialized
[0.338s][info][jfr] Created repository /tmp/2020_06_19_13_08_28_6
[0.367s][info][jfr] Creating thread sampler for java:20 ms, native 0 ms
[0.367s][info][jfr] Enrolling thread sampler
[0.367s][info][jfr] Enrolling thread sampler
[0.367s][info][jfr] Updated thread sampler for java: 20 ms, native 0 ms
[0.367s][info][jfr] Updated thread sampler for java: 20 ms, native 0 ms
[0.367s][info][jfr] Updated thread sampler for java: 20 ms, native 20 ms
[0.373s][info][jfr] Started recording "startup" (1) {maxsize=200.0MB, dumponexit=true, duration=6m, filename=/var/log/jfr/startup.jfr}
...
[0.847s][info][jfr] Updated thread sampler for java: 0 ms, native 20 ms
[0.847s][info][jfr] Disenrolling thread sampler
[0.848s][info][jfr] Stopped recording "1" (1). Reason "Dump on exit".
[0.862s][info][jfr] Wrote recording "1" (1) to /var/log/jfr/startup.jfr
[0.864s][info][jfr] Closed recording "1" (1)
[0.866s][info][jfr] Removed repository /tmp/2020_06_19_13_08_28_6Increasing the log level may reveal additional details.
Memory usage in the process
The section above describes where the actual data is saved for long or large
(duration, maxage, maxsize) profiling sessions, e.g. the reposotory, on disk,
will grow within these constraints. JFR is safe to enable in prod but there’s an
overhead in memory as well, although it’s usually minimal compared to the heap
or other native memory sections, but it’s worth mentioning.
If NMT is enabled, you can just display the summary:
$ jcmd $(pidof java) VM.native_memory
6:

Native Memory Tracking:

Total: reserved=5324939KB, committed=3600539KB
-                 Java Heap (reserved=2793472KB, committed=2793472KB)
                            (mmap: reserved=2793472KB, committed=2793472KB)

...

-                   Tracing (reserved=75866KB, committed=75866KB) (1)
                            (malloc=75866KB #85438)

...| 1 | JFR’s Tracing memory zone uses ~74MB |
This was taken on a very active application, with custom events, you mileage may vary.
The next output shows the committed memory for tracing, after a 6 min recording, which means JFR will keep a memory zone any. That is the minimal JFR footprint I experienced.
-                   Tracing (reserved=21041KB, committed=21041KB)
                            (malloc=21041KB #2783)
Analyze with jfr
Now to exploit the recording, we have a tool named jfr that ships with the JDK.
On Linux the alternative jdk management may not be aware of jfr, which means
you may need to use the full path to this executable.
The first interesting thing to do is to get an overview of the recording,
the summary sub-command displays an histogram of the events.
$ jfr summary /tmp/app-profile-2020-03-26T16-57-14.jfr

 Version: 2.0
 Chunks: 1
 Start: 2020-03-26 16:57:14 (UTC)
 Duration: 303 s

 Event Type                            Count  Size (bytes)
===========================================================
 jdk.ThreadPark                       130278       5868710
 jdk.SocketRead                        38804       1934842
 jdk.JavaMonitorWait                   38722       1378513
 jdk.NativeMethodSample                14702        263403
 jdk.ThreadCPULoad                     11821        271763
 jdk.ExecutionSample                    3010         54177
 jdk.ModuleExport                       2505         40187
 jdk.ClassLoaderStatistics              2344         72694
 jdk.ThreadAllocationStatistics          878         16962
 jdk.ModuleRequire                       754         11964
 jdk.BooleanFlag                         648         23106
 jdk.CPULoad                             298          7450
 jdk.JavaThreadStatistics                298          6258
 jdk.ClassLoadingStatistics              298          5066
 jdk.CompilerStatistics                  298         11324
 jdk.ExceptionStatistics                 298          6258
 jdk.ActiveSetting                       285         10497
 jdk.BiasedLockRevocation                275          7831
...
 jdk.GCPhasePauseLevel1                   20           965
 jdk.CheckPoint                           17       1631868
 jdk.ExecuteVMOperation                   15           391
 jdk.DoubleFlag                           13           618
 jdk.BiasedLockClassRevocation            10           275
 jdk.GCHeapSummary                        10           475
 jdk.MetaspaceSummary                     10           580
 jdk.G1HeapSummary                        10           300
 jdk.OldObjectSample                      10           367
...
 jdk.BiasedLockSelfRevocation              2            45
 jdk.PhysicalMemory                        2            46
 jdk.ThreadDump                            2       1389568
 jdk.CodeSweeperStatistics                 2            64
 jdk.GCConfiguration                       2            60
 jdk.ThreadEnd                             1            17
 jdk.Metadata                              1         74738
 jdk.JavaMonitorEnter                      1            33
 jdk.SafepointBegin                        1            24
 jdk.JVMInformation                        1           898
 jdk.OSInformation                         1           367
 jdk.VirtualizationInformation             1            33
 jdk.CPUInformation                        1          1432
 jdk.CPUTimeStampCounter                   1            25
 jdk.CompilerConfiguration                 1            15
 jdk.CodeCacheConfiguration                1            51
...
 jdk.X509Certificate                       0             0
 jdk.TLSHandshake                          0             0
But other interesting things could be done using this tool.
The print sub-command can extract these events, in XML or in JSON. From there
it’s possible to perform other type of aggregation using other tools.
jfr and jq$ jfr print \
--json \
--events jdk.ThreadPark \
/gclogs/startup.jfr \
| jq '.recording.events[] | .values.duration'It’s also possible to assemble jfr files or break them in smaller parts.
As a side note, the files in the repository can be exploited this way.
Keep in mind these files may be removed as soon as they are expired or as
soon as every recording stops.
$ jfr summary /tmp/jfr-repo/2020_06_26_16_03_41_6/2020_06_26_16_04_12.jfr
Version: 2.0
Chunks: 1
Start: 2020-06-26 16:04:12 (UTC)
Duration: 35 s

 Event Type                            Count  Size (bytes)
===========================================================
 jdk.ThreadPark                        19853        918218
 jdk.SocketRead                         6459        325796
 jdk.JavaMonitorWait                    5581        200005
 jdk.ClassLoaderStatistics              2620         81098
...
Controlling JFR programmatically
While JDK 14 allows consuming events on the fly, previous JDK versions (from JDK 11) offer a public API useful enough to control Flight Recorder programmatically or to read events from a JFR file.
Configuration c = Configuration.getConfiguration("profile"); (1)
Recording r = new Recording(c);
r.setName("monitor jvm");
r.enable("jdk.*"); (2)
r.setMaxAge(java.time.Duration.ofMinutes(4)); (3)
r.start(); (4)

// to be profiled

r.stop(); (5)
r.dump(Files.createFile("/var/log/jfr/app-initiated.jfr")); (6)| 1 | As shown above choose the JFR configuration. |
| 2 | Choose which events the recording should be interested in. Another signature accepts classes, it’s unlikely to be helpful for JDK events, but it may get interesting for custom events, your classes. |
| 3 | Eventually set recording constraints, like the maximum age of the records. |
| 4 | Hit record |
| 5 | When the recording session is over, stop JFR. |
| 6 | Then store the results in the location of your choosing. |
The above snippet creates a continuous profiling session with a 4 minute window.
Now the API allows reading emitted .jfr files. The API represents what’s actually
in a file, a schema of the events and the events themselves.
try(RecordingFile rf = new RecordingFile(Paths.get("/var/log/jfr/app-initiated.jfr"))( { (1)
    // read the schema
    rf.readEventTypes().forEach((EventType et) -> { (2)
        System.out.println(et.getName());
        et.getFields()
          .stream()
          .map((ValueDescriptor vd) -> vd.getName())
          .forEach(System.out::println);
    });

    // actual events
    for(jdk.jfr.consumer.RecordedEvent e = rf.readEvent(); rf.hasMoreEvents(); e = rf.readEvent()) { (3)
        System.out.println(e.getEventType().getName()); (4)
    }
}| 1 | Open the JFR file, it’s a Closeable and it reads a file, so be sure to use
it in a try-with-resources block. |
| 2 | readEventTypes() gets you the schema of the events, fields name, labels, thresholds, etc. |
| 3 | Then there’s this weird enumeration style api to read the events hasMoreEvents() and readEvent() |
| 4 | Access details on the event type. |
RecordingFile api is a bit awkward to work with, more specifically parsing each event
requires looking at the event descriptor (via getEventType(), or getFields()), and interrogate
the event as fields presence may evolve with each JDK revision. The javadoc advises defensive
programming style when reading a JFR file :
if (event.hasField("intValue")) {
   int intValue = event.getValue("intValue");
   System.out.println("Int value: " + intValue);
}
This API is now complemented by streaming live events JEP-349
in JDK 14 using an API RecordingStream that is mix of the above, that’s out of scope for
this article. But that’s yet another reason to make the effort to upgrade our JDK.
Such API facilities are useful especially when combined with other technologies like Spring Actuators. Yet when there’s available integration or when using these integrations is too late, like recording startup the most actionable way to get recording is from the command line.
How and when to record in production
The next points will present command line flags to set up JFR.
On JDK 11 there is the JDK_JAVA_OPTIONS
environment variable. I found this variable particularly useful to tweak JVM parameters
in a containerized environment without having to rebuild the image. This environment variable
only affects java while JAVA_TOOL_OPTIONS affects any binary in the JDK java, jps, jcmd, etc.
|
While it would certainly be useful to record the whole lifetime, this is unpractical, even plane Flight Data Recorder (and Cockpit Voice Recorder) only keep recent history. Instead, it’s possible to aim at specific time frames where a recording could be useful:
-
At startup, the JVM does a lot of things, so does the application, it generally initialize a lot of long lived objects, generally services, threads, etc.
-
Continuously at runtime, this is likely a sliding time window in which one can access what’s happened in last X <time unit> (this is either limited by age or by size). It this case the dump could be done when required.
-
At shutdown whether the JVM was killed or crashed. It this case the JFR files are an alternative to heap dumps for the autopsy.
Record application startup
I mentioned startup as a separate window, because it’s useful to inspect startup recording. During this time, the JVM initialize a lot of things, most code has yet to be warmed up, depending on the workload there may be a lot of allocations.
I found that having this startup recording very useful to tune the readiness of an application, as we’ll see after.
-XX:StartFlightRecording=settings=profile,duration=6m,name=app-startup,filename=/var/log/jfr/app-startup.jfrEventually it’s possible to tweak this recording with, other parameters like:
-
path-to-gc-roots=true, which allows to identify leaks using theOldObjectSample(enabled in theprofilesettings) -
maxsizeto set a size threshold to the recording -
disk=falseif you want to keep the event in memory only before dumping to the configuredfilename. Otherwise the JVM will use it’s default strategy which is to evacuate chunks of event to disk, in the JFRrepository(by default a folder in the temporary folder).
In addition to these recording parameter, it can be useful to set a few JFR wide options, i.e. that affects all
recordings, e.g. -XX:FlightRecorderOptions=stackdepth=96, which augments the size of the captured stack,
be advised, that the bigger the number the higher the impact.
❯ jcmd $(pgrep java) JFR.check
6:
Recording 1: name=app-startup duration=6m (running) (1)
❯ jcmd $(pgrep java) JFR.check
6:
No available recordings. (2)

Use jcmd 6 JFR.start to start a recording.
❯ ls -lah /var/log/jfr/app-startup.jfr
-rw-r--r-- 1 root root 57M May 6 22:35 /var/log/jfr/app-startup.jfr| 1 | Indicates the configured 30s recording is ongoing. |
| 2 | No more recording once the duration is over. |
I’ll show how to use this recording later in this article.
Record application post-startup or continuous recording
Once startup has been recording, it’s useful to set up a continuous recording.
The good thing is that the JVM allows to define multiple recording
in the command line. Let’s add another -XX:StartFlightRecording
with the delay parameter.
-XX:StartFlightRecording=settings=profile,delay=5m,maxage=10m,name=post-startup,filename=/var/log/jfr/post-startup.jfrThis will register a continuous profiling that will start 5m after the JVM starts. And
it sets a retention of 10 minutes, or a retention of the default maximum size which is 250 MiB in JDK11.
If this is the only recording, JFR.check will output something like that.
$ jcmd $(pgrep java) JFR.check
6:
Recording 1: name=post-startup maxage=10m (delayed) (1)
❯ jcmd $(pgrep java) JFR.check
6:
Recording 1: name=app-startup maxage=10m (running) (2)| 1 | Indicates there’s a recording that will start at some point in the future. |
| 2 | Indicates the configured continuous recording is ongoing. |
Note that in the case of the continuous recording it’s necessary to dump the recording
via JFR.dump.
Recording for shutdown
The only thing to do is to set the recording parameter dumponexit=true (on each recording).
The record will be stored in the configured filename otherwise JFR will create a file similar
to this the working directory of the process hotspot-pid-6-id-1-2020_05_03_12_54_14.jfr.
Later on I discussed with
Erik Gahlin and he told me that the filename attribute
accepts a path to an existing folder, so that dumps on exit are dumped in this folder.
IN the following filename hotspot-pid-6-id-1-2020_05_03_12_54_14.jfr,
-
pid-6is the process identifier, usually it’s the same in a container. -
id-1is the recording identifier, the identifier is assigned following the order ofStartFlightRecordingoptions, new recordings started byjcmdwill be given an identifier as well. -
2020_05_03_12_54_14is the date at which this dump has been created.
The generated name make it uneasy to correlate recordings when a container is restarded several times, but that can be worked with.
|
The JVM source code, suggest that JFR has the notion of
emergency JFR dump,
but the mechanism is different as it seems those are dumped in the
working directory of the process, which may not be writable in a container. I don’t
think it’s currently possible to change the location. But
from what I’ve seen a
In practice, for the stack overflow and the java heap out of memory errors,
I never witnessed dumps named this way, instead the recording seem to
follow the configured location or the default one |
Putting it all together
Putting it all together, let’s put these in the JDK_JAVA_OPTIONS.
-XX:StartFlightRecording=settings=profile,duration=6m,name=app-startup,dumponexit=true,filename=/var/log/jfr/app-startup.jfr
-XX:StartFlightRecording=settings=profile,delay=5m,maxage=10m,name=post-startup,dumponexit=true,filename=/var/log/jfr/post-startup.jfr
-XX:FlightRecorderOptions=stackdepth=96
After acquiring the record files, you are ready to exploit them. We’ve seen jfr on which
it’s possible to build upon, now the next section briefly presents the other elephant in the room
(in a positive way), JDK Mission Control which empowers its user with remarkable diagnosis skills.
JDK Mission Control
JDK Mission Control, is a tool that will make sense of all these events, and it excels at that.
In an event sourcing system, the query part of the system is what empowers the view, JDK Mission Control uses these events to present several consolidated views tailored to diagnose several part of the JVM runtime, and more if using custom events.
On macOs you can install it via Homebrew (brew cask install jdk-mission-control).
As mentioned earlier Mission Control was present before in the JDK, however it’s user interface evolved quite a bunch and following the official Oracle troubleshooting guide for Java 11 to inspect a recording may get be a bit confusing. And even the shipped help pages of JMC are sometime outdated, or explicit about which version of the JDK the help section makes references to.
| At this time the JDK Mission Control 7.1 is available, and the 8 snapshot are also available for the edge users. I’m using the 8 snapshots but the 7.1 does the job very fine. |
Enough text, let’s see how to use JDK Mission Control on a concrete issue.
| A large screen will be really appreciated when looking at JMC. My 13 inches laptop is way too narrow in my opinion, using a 27 inches monitor really adds to usability. |
Real case startup request latencies
At some point we had an issue with application startup performance. For a bit of context this app runs in a Kubernetes cluster, with k8s it’s possible to define a rollout policy to avoid service disruption, that what we had, so there’s a rollout, new pods (a pod is composed of the application container) get created, new application are started, then Kubernetes has a mean to check when the application is ready, it’s called the readiness probe. This probe can be a call to http endpoint or a script, ours is an HTTP endpoint.
When the probe indicates the application is ready, the application starts receiving traffic, from this moment latencies increased from 10-20 milliseconds to seconds.
Opening the recording JMC, it will start an automated analysis. Sometime it’s helpful and warning should be looked at. In this case the issue was elsewhere.
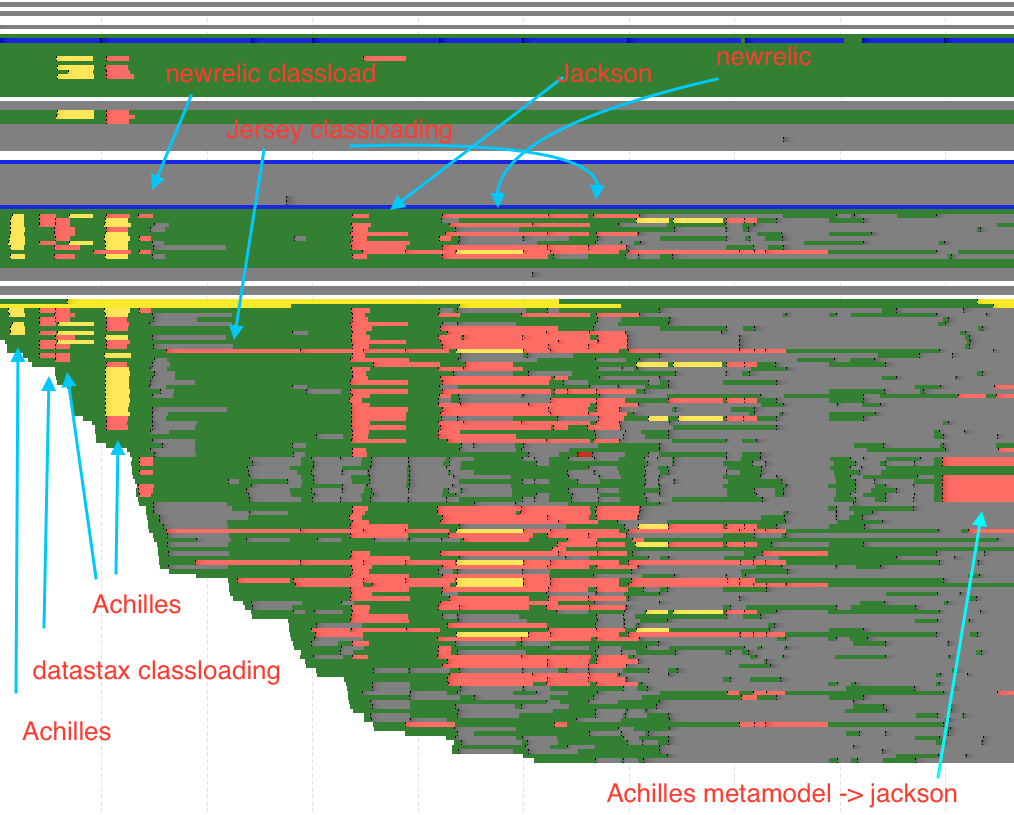
To help in our case, I needed to go in the thread view, which as a thread lanes which displays each thread as an horizontal bar, and JFR event are painted on the bar at the time they happened and for how long. At the bottom there’s the time axis.
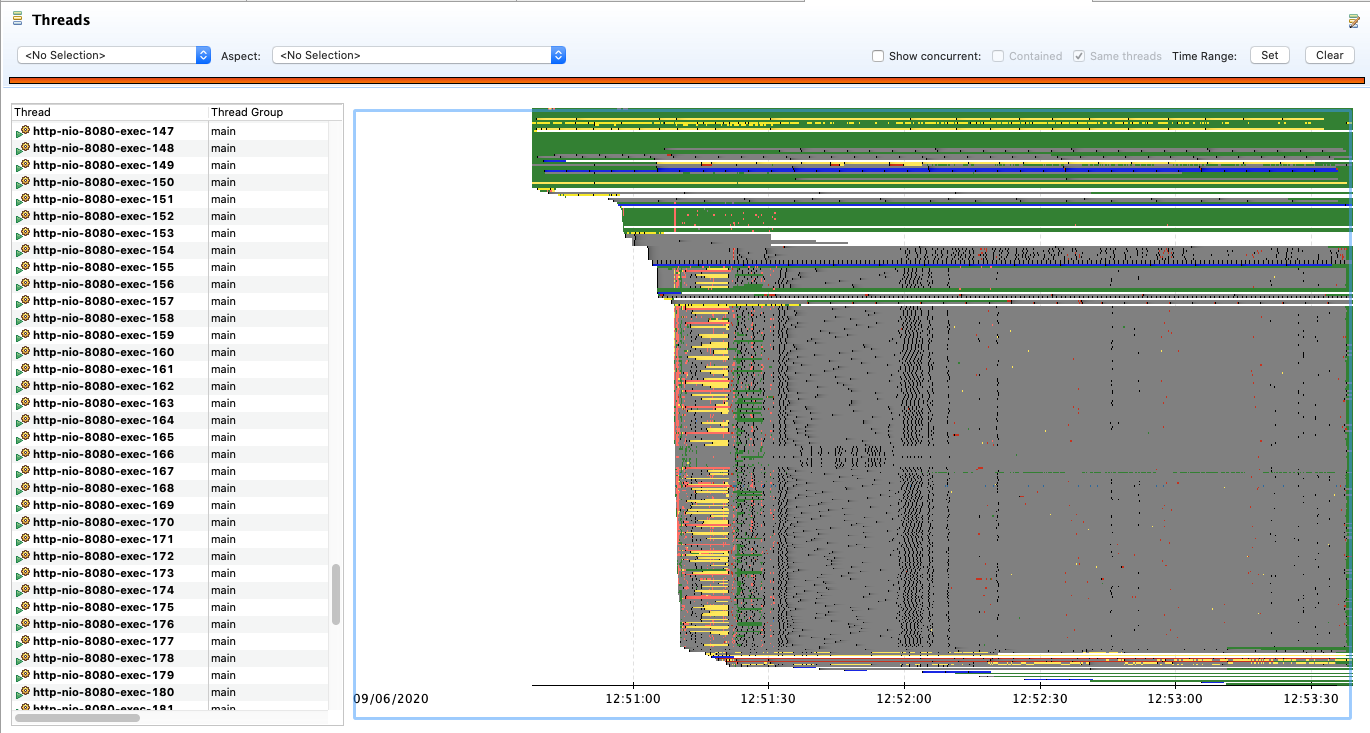
The first things that catch our eyes will be the vertical patterns, especially the one with yellow and red around 12:51:15. Let’s zoom (you can select and right click, or use arrow keys.).
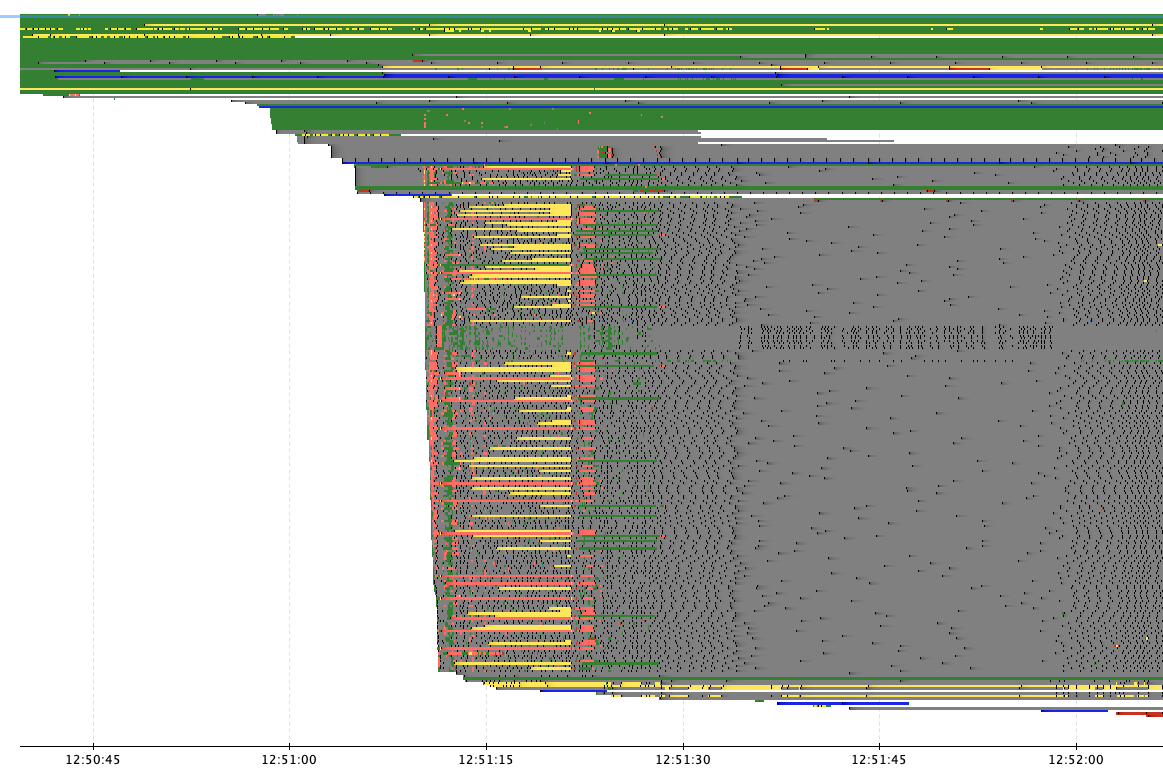
The vertical pattern is more precise, these vertical pattern indicates a cross threads phenomena. And we can notice that all thread are not affected the same way.
The lanes in green at the top indicates these threads are progressing normally, nothing’s wrong with them. However, if we go down there especially, the pattern materialize around 12:51:11.
Each color indicate some events:
-
Gray ⇒ the thread does nothing, it’s parked
-
Small dark point ⇒ The park event, the thread was scheduled but was eventually parked
-
Red ⇒ In this case it’s a blocked lock
-
Yellow ⇒ Here the yellow events that interests us are thread waiting on a lock
I’m not well versed in describing colors, so know that there are other events that use a slightly different tone / shade of red, yellow or else. Just click on the event to see what’s going on.
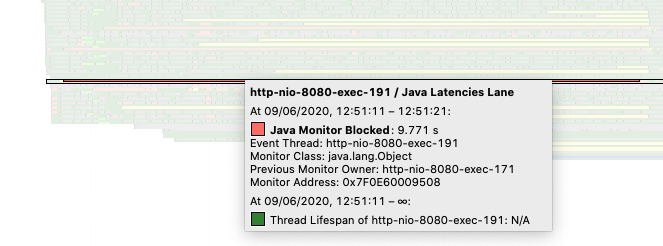
The UI could be improved but going over the events shows a popup with its details, for the Monitor Blocked event, there’s the duration this monitor was block, who held this monitor before, and the monitor address in the heap.
This monitor was held for ~9s, that’s a big bottleneck !
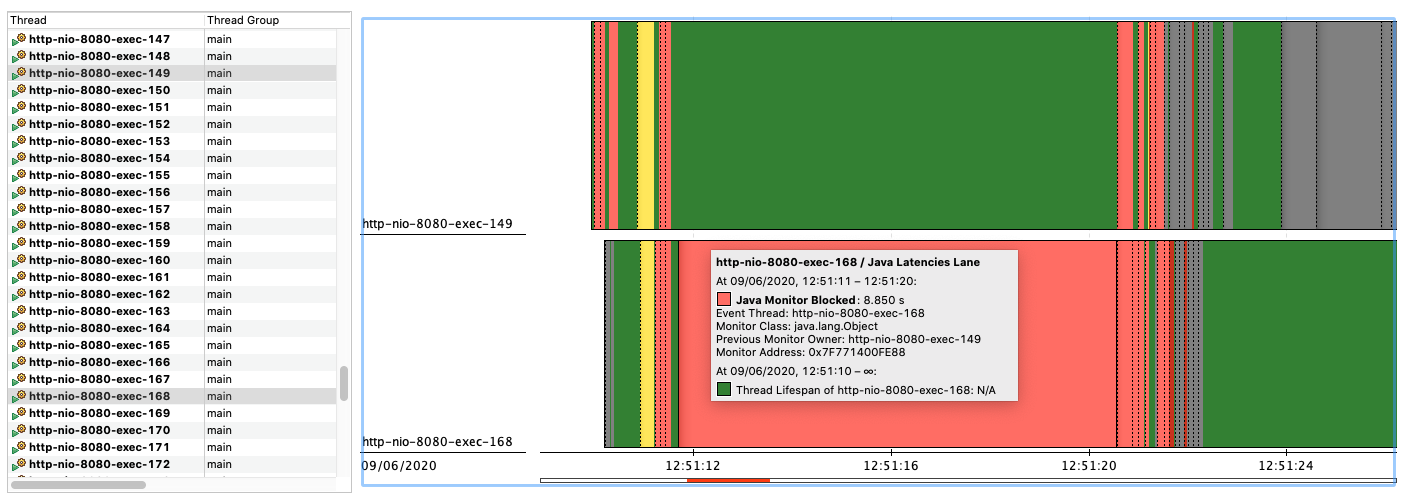
In this case this application had ~200 thread competing for this lock in particular. And finding the thread that acquired it is not automated, it’s a bit tedious, but in the end didn’t reveal anything.
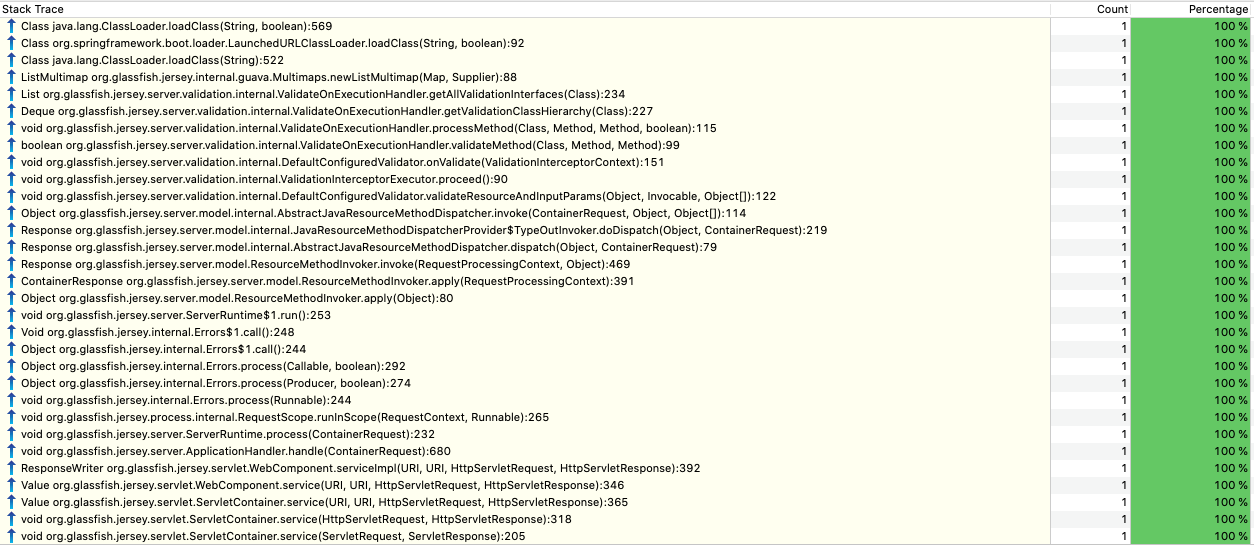
However, the Monitor Blocked event has another interesting element, the stacktrace. In the lower pane of JMC, if the event is selected, we can see the stack trace where this event was emitted.
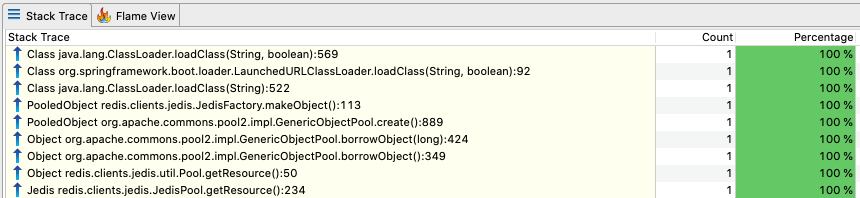
Here that’s the JDK classloader. I would never have thought that the JDK code would cause ~9s contention. But looking at the stacktrace, there jedis (a Redis client) connection pool involved. Maybe the class have static initialization that does IO, maybe it’s the agent that runs in production that introduces latencies during this specific classloading.
But all the threads starts working again around 12:51:22, and redis bottleneck is not anymore an issue afterward. Let’s look at the story on the IO side, open the Socket IO view.
Identify which one is related to redis, either via IP or via port (Redis is 6379).
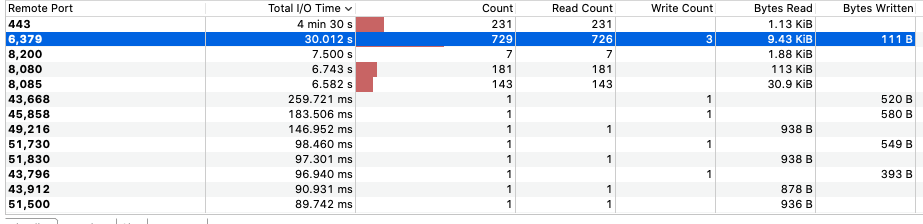
While we see a total time of 30s, it’s the accumulated time for all thread for the recording duration (6m). So nothing fancy here. However, we see that actual IO happens later, around 12:51:22.
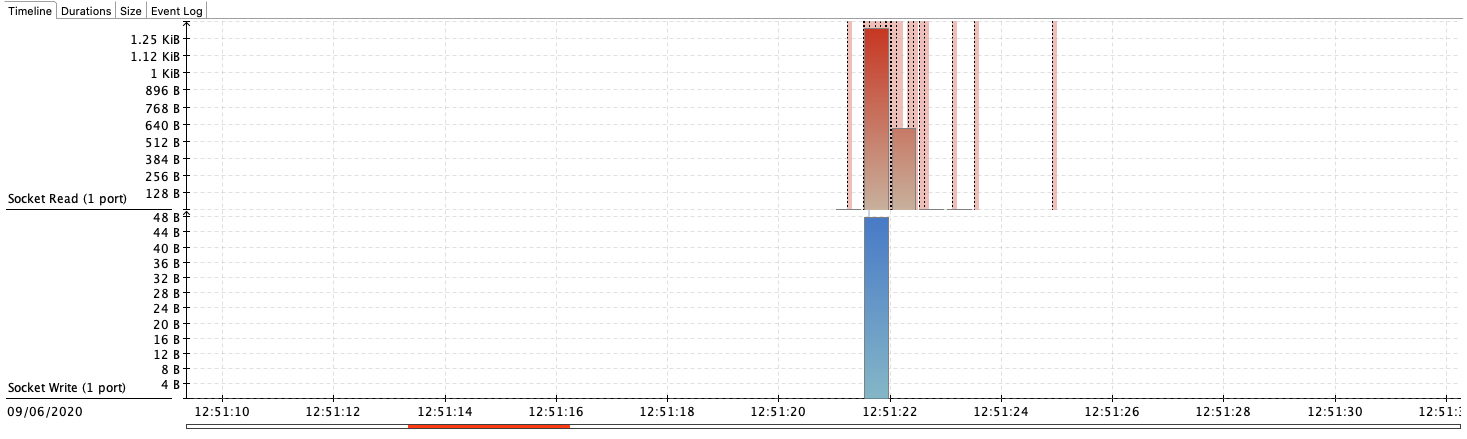
I’m not sure of the cause, we can definitely rule out Redis, the is either in the network, during connection establishment, or actually during classloading.
In order to remediate that, we noticed this code is called once the application is ready. So in order to avoid the contention the code was changed to pre-connect to redis during the application startup before the application is considered ready. And it worked, this specific issue disappeared.
The issue identified in the first recording showed some contention on redis, this is now gone. There is however in this second iteration multiple other issues when flying the mouse pointer over the yellow and red events.
ListMultiMap classloading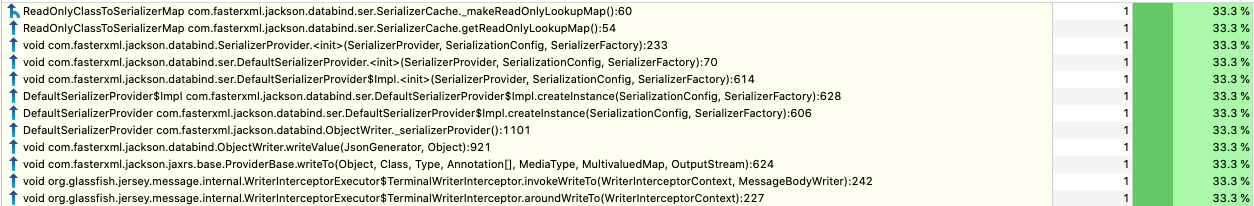
SerializerCache initialization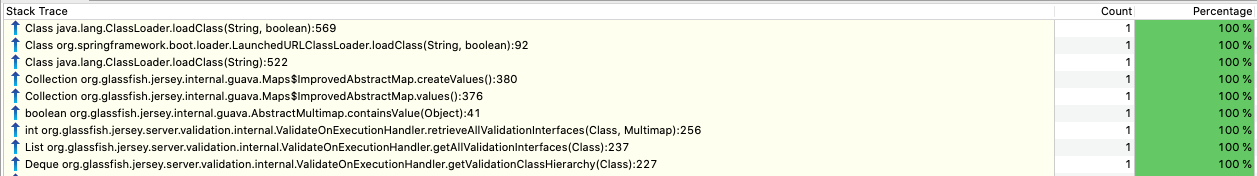
ImprovedAbstractMap classloading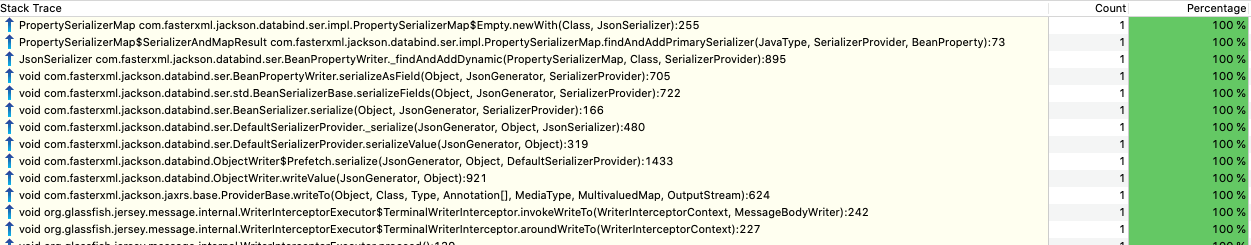
PropertySerializerMap initialization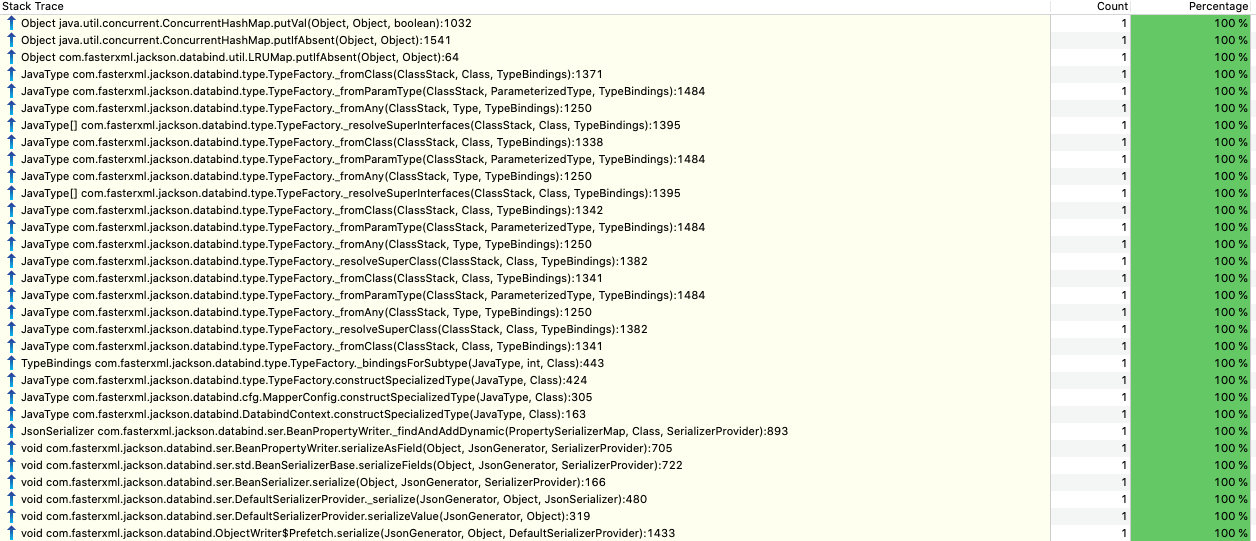
TypeFactory initialization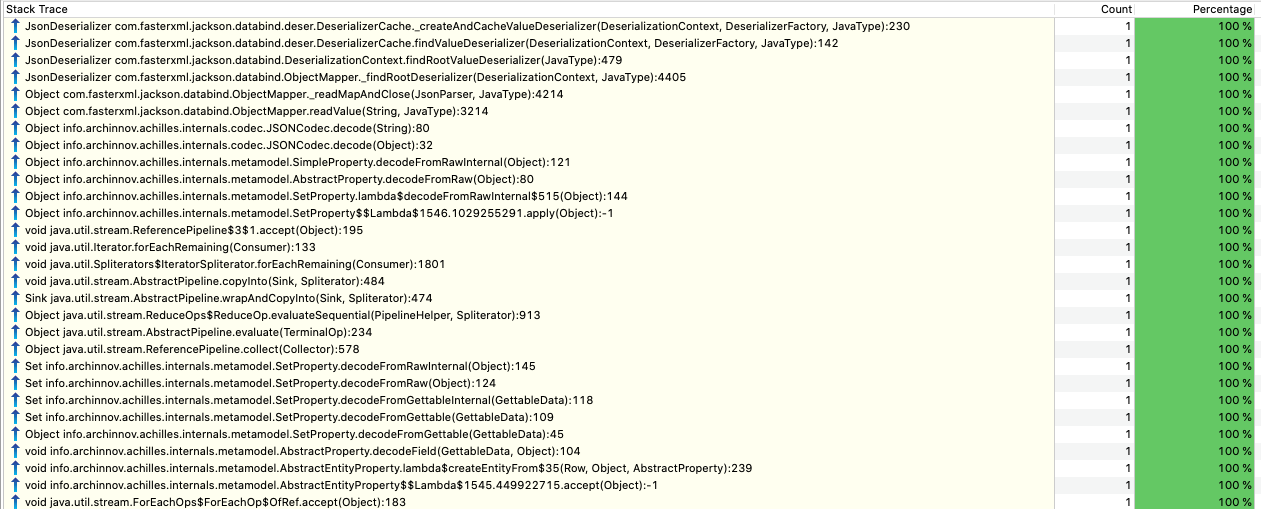
DeserializerCache initialization
hash function involving classloading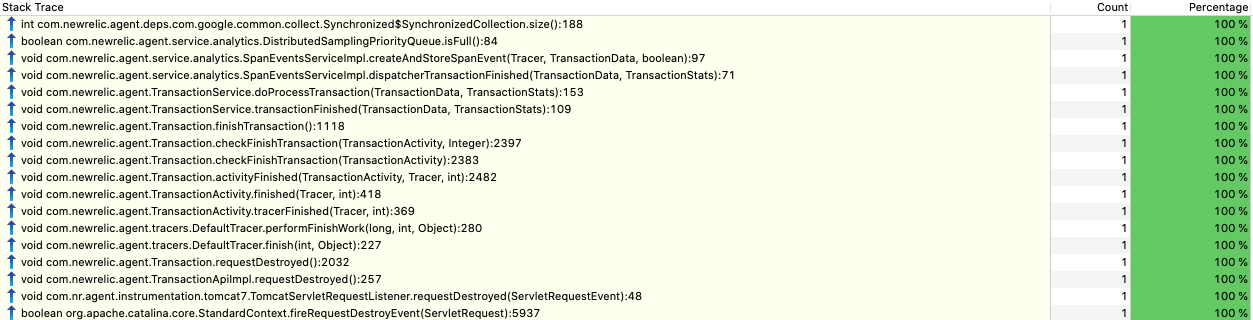
SynchronizedCollection.size()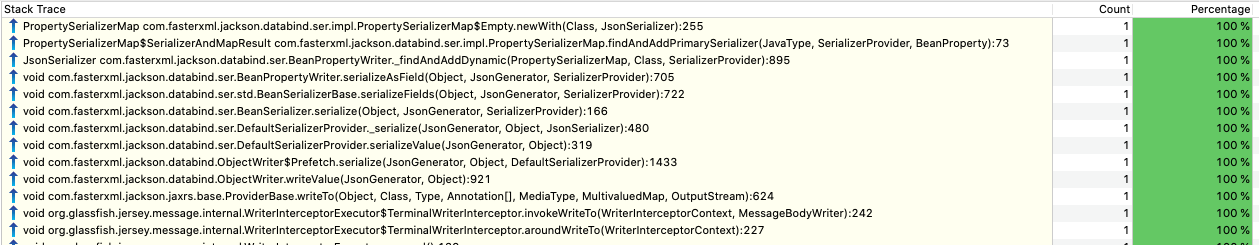
PropertySerializerMap initialization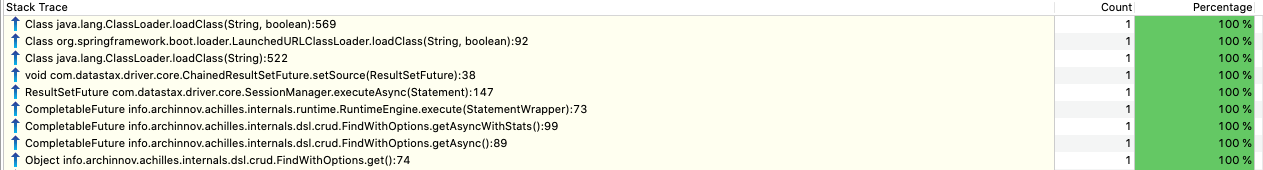
ChainedResultSetFuture involving classloading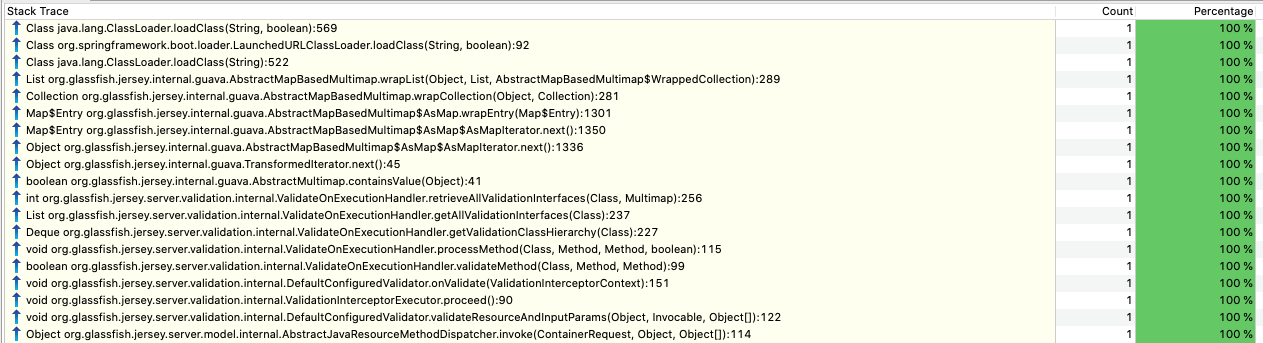
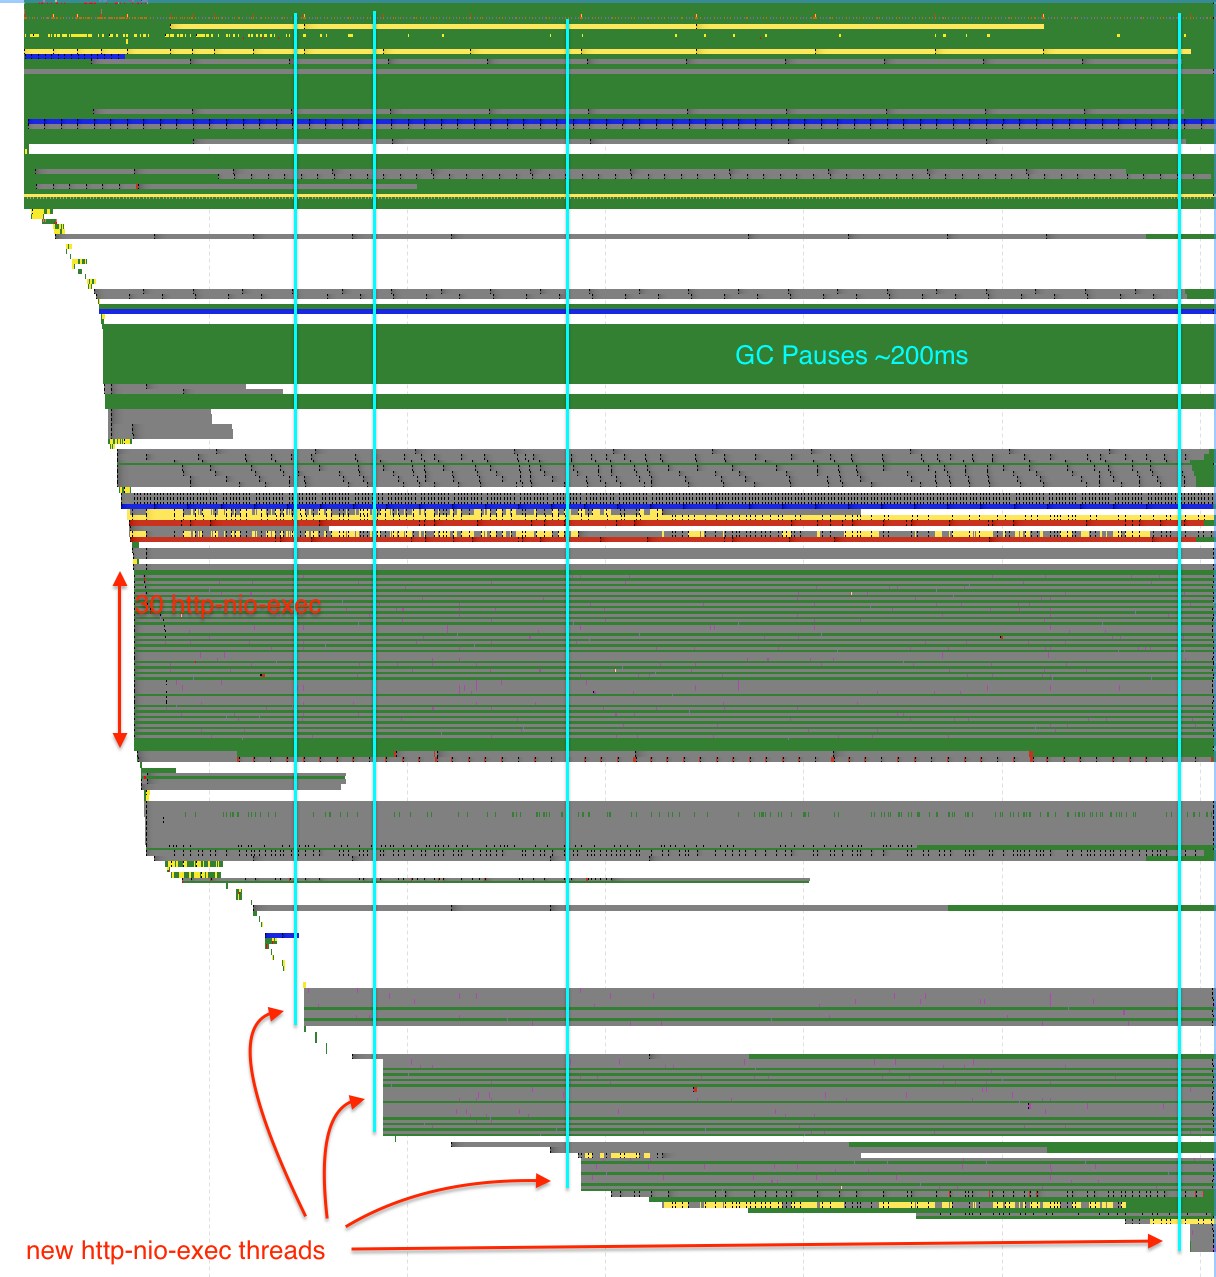
AbstractMapBasedMultimap involving classloadingAll the stacktraces above have one thing in common, a contention on a lock. As thread were blocked, and new request appeared, this had the effects of increase the queuing, and made tomcat creates new http nio worked threads until the maximum is reached (200 by default). I applied the same trick: i.e before readiness, exercise code paths that are lazy initialized. And it worked too. Most contention disappeared afterward.
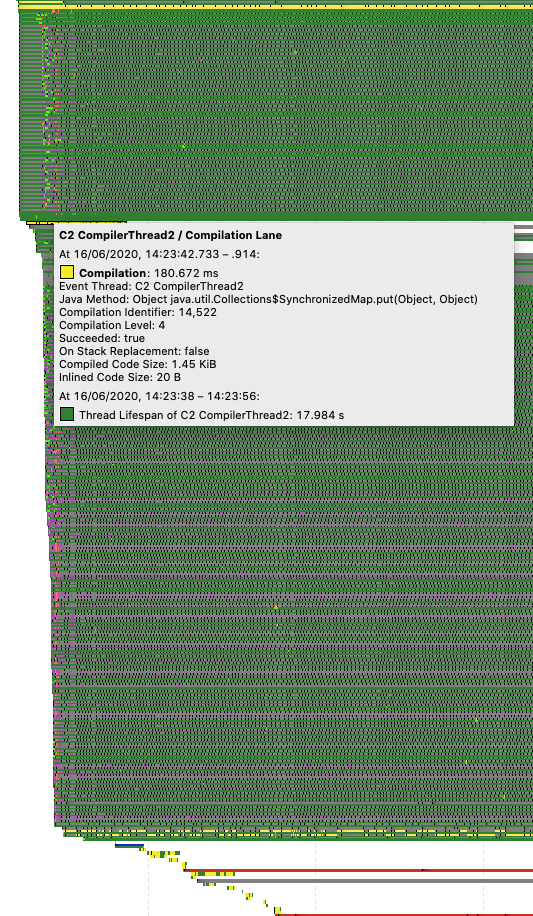
There was still some potential gain however. I noticed a few C2 compiler related events. If you don’t know C1 and C2, those are the compilers that transform bytecode to assembly. C1 interprets the bytecode and may perform some tricks like escape analysis, but its role is to be fast to execute bytecode and not about optimizing the machine code assembly. In a second phase C2 may kick in for hot code path that is code that is executed very often, and its job is to output highly optimized code at the cost of higher computation resources.
Note this compilation event is not blocking threads !
As an experiment I used the Graal compiler, which I believe is the new
generation of compiler that have a chance to replace C2. Graal compiler
is part of the GraalVM project.
It ships as an experimental option : -XX:+UnlockExperimentalVMOptions -XX:+UseJVMCICompiler.
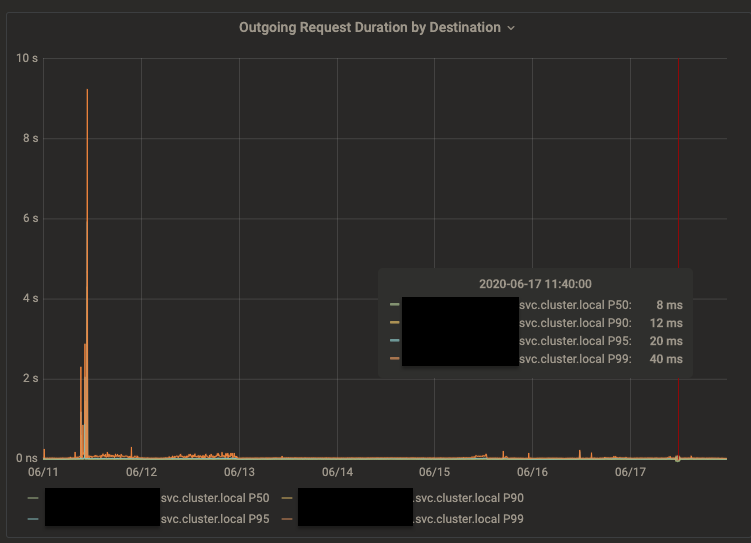
And the result for this work load in particular, just activating the Graal compiler between these two successive rollouts.
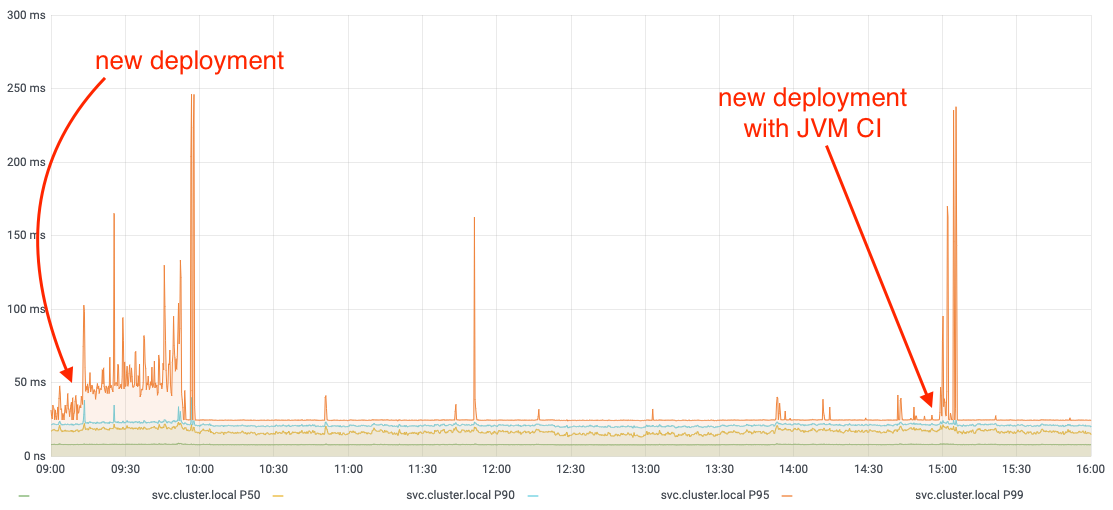
This graph is falling under the percentlie but the improvement is still visible.
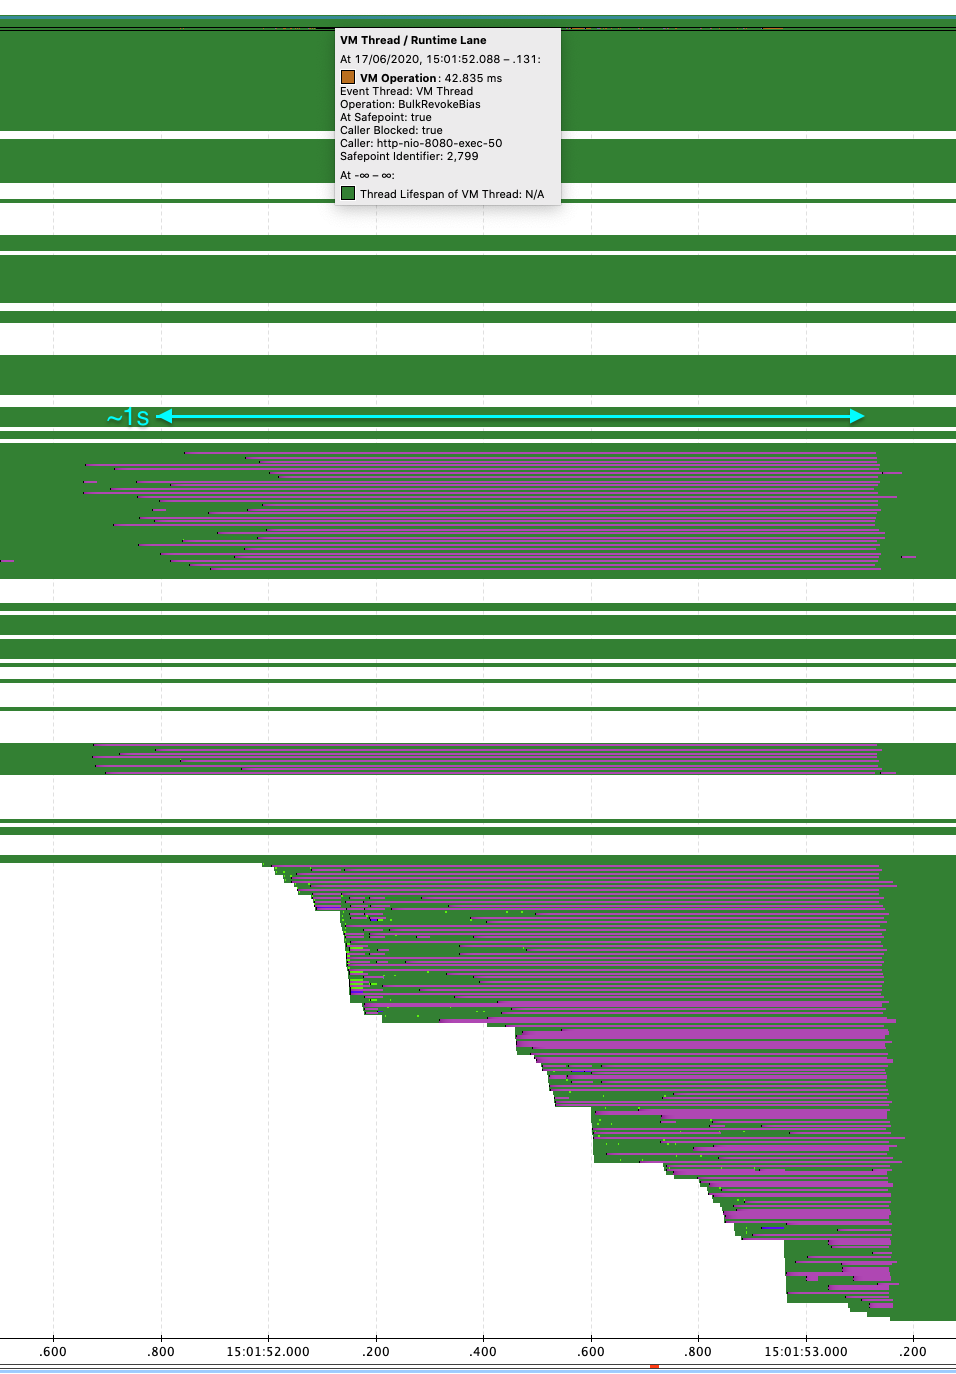
After that experiment when I analyzed the new profile I noticed that JVM was using a lot of time to revoke bias locking. Note the events in fushia are custom JFR events that track HTTP requests. (Gunnar Morling has an inspiring write up about it).
This VM operation is done during safepoint during which the JVM is paused. At this time a lot of bias revocation event appears, so we removed them, and it works too.
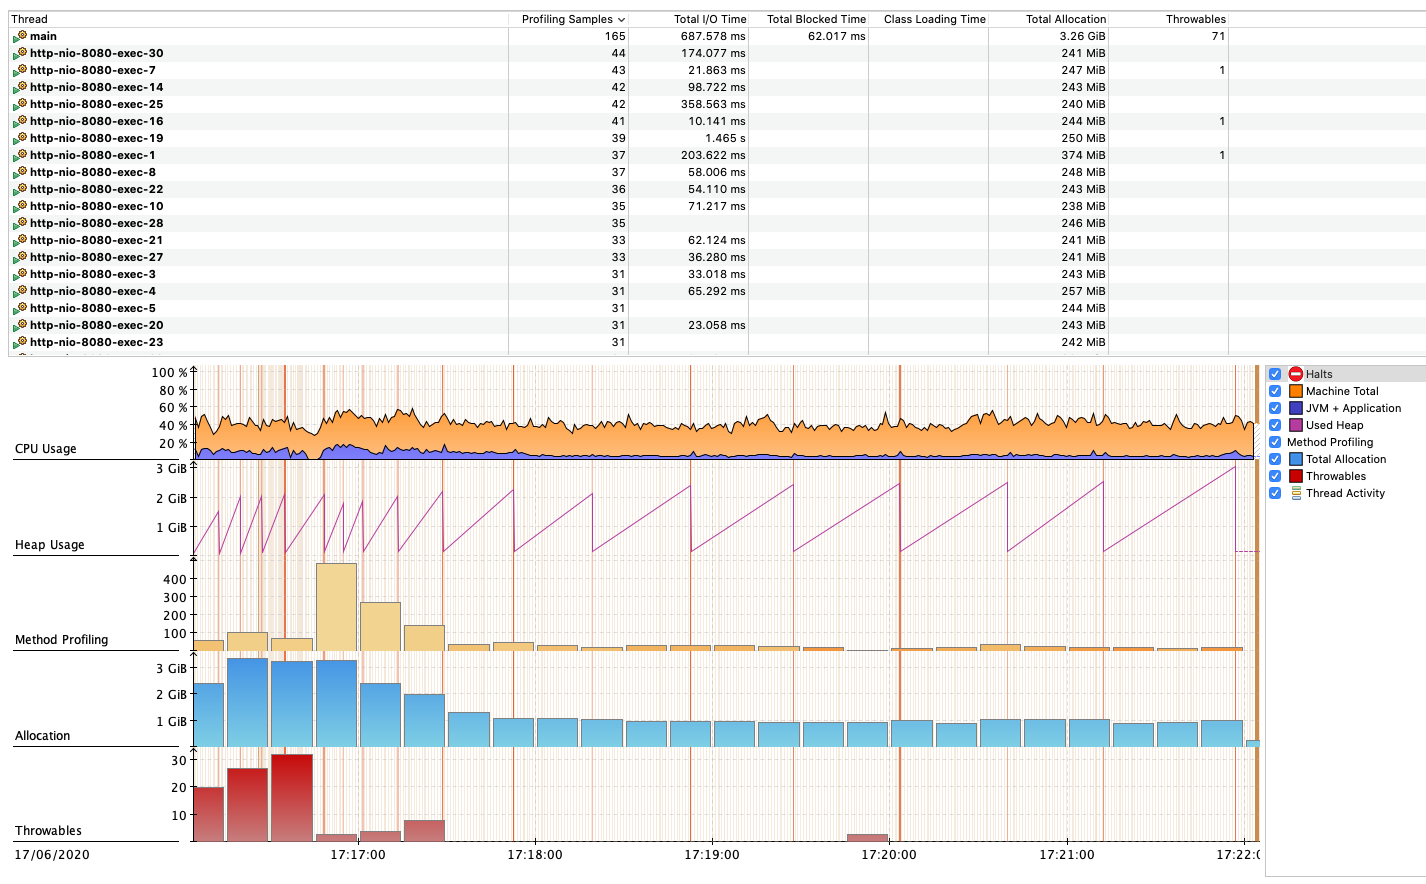
The graphic below shows the difference in startup time. Other consuming backend services had to timeout and eventually perform retries during rollouts which increased the pressure on the application.
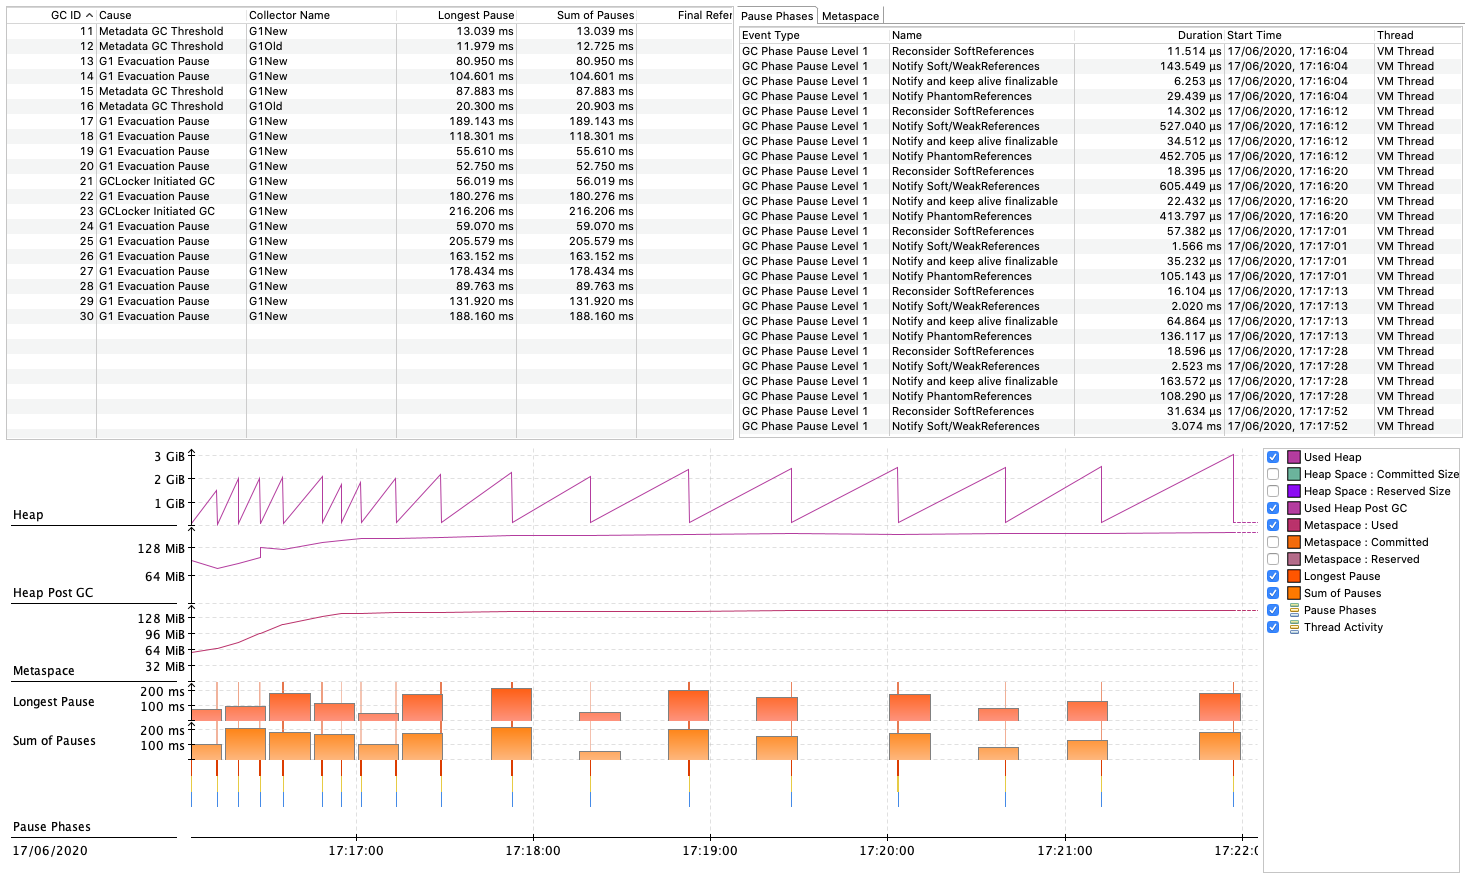
Other smaller issues could be discovered and tackled, for example I noticed a few gaps 200ms wide at 30/1min intervals that were related to GC pauses.


For this application the GC is working within 20ms excepts for a few larger pauses during the early minutes of startup:
Tuning GC is out of scope for this article, but JMC presents a nice view that could help identify GC causes. In my opinion it’s currently a bit less powerful as GC logs because GC events lack useful information only found in GC logs with appropriate tags and level.
Anyway from there we could imagine a setting file in the JDK dedicated for GC events. Instead of parsing log files whose string format that may change a bit over releases (even with unified logging) GC events could be analyzed leveraging the included JFR schema.
Also, with JFR it’s even possible to record memory leak using the profile settings file,
I never tried that in a real situation though, but if this avoids the need to make a heap dump
and parse it then I’m all in.
Wrap up
Use JFR in production, use JDK Mission Control !
I’m amazed by the professionalism and the quality of the work BEA put in their JVM (JRockit) in
the early 2000s, thanks to these talented engineer, we have JFR and jcmd (which was named jrcmd).
And thanks to Oracle for making these available for all !.
You may also want to follow Marcus Hirt’s blog, he regularly updates it with useful information on JMC and JFR. As it happens Marucs was the co-founder of Appeal (the company that developed the JRockit), then continued his career at BEA then Oracle.
Finally, here’s a quick thank to David Delabasse for his comments. Recently I’d like to thank Erik Gahlin for his feedback on JFR.
EDIT 2020-09-15 Since this article on JFR and JMC, and due to the JDK Mission Control win, many more article popped up:
-
https://www.morling.dev/blog/introducing-jmfrx-a-bridge-from-jmx-to-jdk-flight-recorder/
-
https://developers.redhat.com/blog/2020/08/25/get-started-with-jdk-flight-recorder-in-openjdk-8u/
-
https://devblogs.microsoft.com/java/how-to-tell-time-in-javas-garbage-collection/
-
https://bell-sw.com/announcements/2020/09/02/Hunting-down-memory-issues-with-JDK-Flight-Recorder/
-
https://tomsondev.bestsolution.at/2020/09/14/javaflightrecorder-event-documentation/
It’s been a long journey, with over 28k votes cast. But it's all led us to this moment...
— Java (@java) July 10, 2020
Congrats to JDK Mission Control for being the winner of the Best of the JDK Feature Face-Off! 🏆Thanks to all who participated!
For the latest #MovedbyJava news: https://t.co/1Uoj9lhpJw pic.twitter.com/Yeb2VwVxX4
Also, be sure to follow Erik Gahlin who is working on JFR as well.